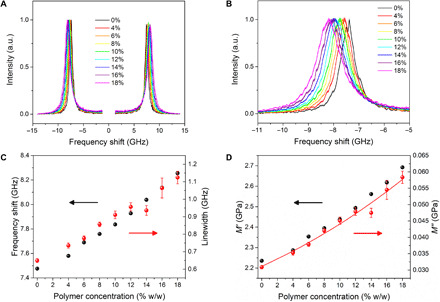
Fig. 1. High hydration Brillouin spectroscopy.

Dependencies of (A) Brillouin spectra, (B) Stokes peak, (C) frequency shift and linewidth, and (D) storage and loss moduli of gelatin gels on polymer concentration. Spectra are normalized to the maximum of the Stokes peak. Full symbols, experimental data; error bars, standard error, i.e., square root of number of counts; red line, linearized model (see text); and a.u., arbitrary unit.
