
Fig. 2. Dispersion in longitudinal storage and loss moduli.
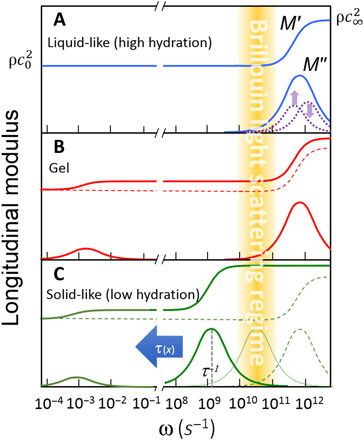
Schematic diagram of the dispersion in longitudinal storage modulus M′(ω) (top curves) and loss modulus M′′(ω) (bottom curves) in the (A) high hydration limit, (B) gel phase, and (C) low hydration limit. Yellow shaded area denotes the Brillouin region [see also (5)].