
Fig. 4. Brillouin microscopy of articular cartilage.
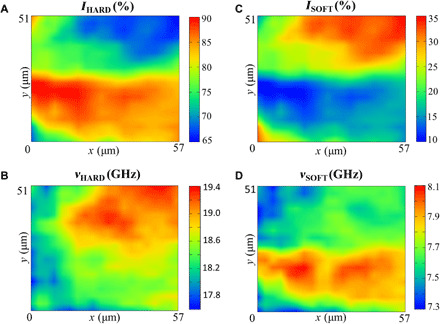
Maps based on (A and C) intensity and (B and D) frequency shift derived from spectral moment analysis (see Materials and Methods). Hard and soft components denote distinct parts of cartilage corresponding to high- and low-frequency Brillouin peaks, 19 and 8 GHz, and are attributed to collagen fiber bundles and matrix-dispersed collagen, respectively.