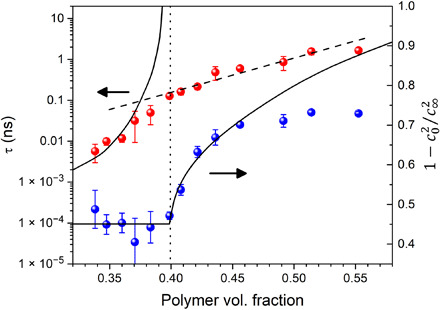
Fig. 5. Concentration dependence of the relaxation time and nonergodicity parameter.

Plot of the relaxation time τ and nonergodicity parameter versus polymer volume fraction x. Deviations of data points (full circles) from ideal behavior (solid lines) can be explained by secondary relaxation processes, which are relevant for real systems. Dashed line is a guide for the eye, and dotted line denotes the ideal critical concentration for the structural arrest predicted by the MCT.
