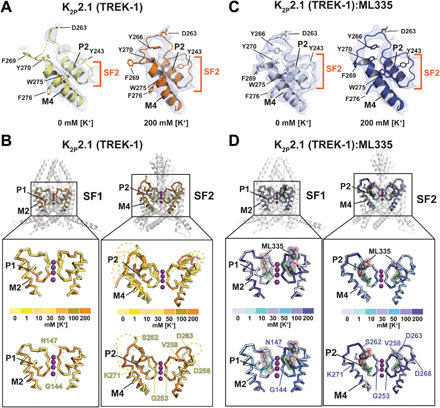
Fig. 1. K2P2.1 (TREK-1) selectivity filter potassium-dependent conformational changes.

(A) Exemplar 0 and 200 mM [K+] K2P2.1 (TREK-1) SF2 2Fo-Fc electron density (1σ). Select residues and channel elements are indicated. Dashes indicate disordered regions. (B) [K+]-dependent structural changes in K2P2.1 (TREK-1) SF1 (left) and SF2 (right). Top: Superpositions of structures determined in 0 (pale yellow), 1 (yellow), 10 (light orange), 30 (yellow orange), 50 (bright orange), 100 (olive), and 200 (orange) mM [K+]. Bottom: Superposition of 0 and 200 mM [K+] structures. Dashed lines indicate regions absent from the structures. Lower panel labels mark model boundaries. (C) Exemplar 2Fo-Fc electron density (1σ) for the K2P2.1 (TREK-1):ML335 complex SF2 at 0 and 200 mM [K+]. (D) K2P2.1 (TREK-1):ML335 complex structural comparisons of SF1 (left) and SF2 (right). Top: Superposition of structures determined in 0 (blue white), 1 (pale cyan), 10 (aquamarine), 30 (light blue), 50 (marine), 100 (slate), and 200 (deep blue) mM [K+]. Bottom: Superposition of 0 and 200 mM [K+] structures. ML335 is gray and shows its molecular surface. Lower panel labels indicate the equivalent residues from (B). Potassium ions are from the 200 mM [K+] structures and are shown as magenta spheres.
