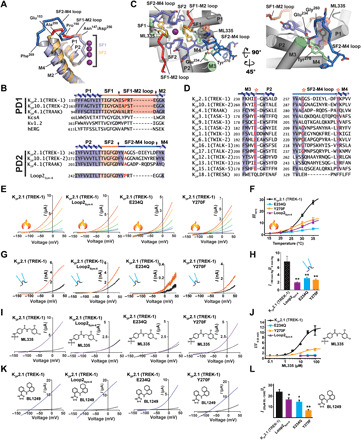
Fig. 5. K2P SF2-M4 loop is central to C-type gate function.

(A) K2P2.1 (TREK-1) P1-SF1-M2 (orange) and P2-SF2-M4 (slate) superposition. SF1-M2 loop (red) and SF2-M4 loop (blue) and portions having a shared conformation (dark blue) are indicated. Residue labels indicate the SF1-M2 and SF2-M4 loop ends and structural divergence point (Pro150/Ala259). (B) Sequence comparison. Arrows denote selectivity filter–outer transmembrane helix linker ends. Red indicates Pro150/Ala259 equivalents. (C) K2P2.1 (TREK-1):ML335 complex SF2-M4 loop details. SF1 (yellow), SF2 (slate), SF1-M2 (red), and SF2-M4 (marine) are indicated. Conserved Glu234 (green), Tyr270 (green), Gly260 (marine) hydrogen bond network is indicted. ML335 is shown as sticks and space filling. (D) Human K2P channel M3 glutamate network conservation (red and asterisks). Figure S7 has sequence codes. (E) Exemplar two electrode voltage clamp (TEVC) recordings at 15°C (blue), 20°C (light green), 25°C (lime green), 30°C (orange), and 35°C (red). (F) Normalized temperature responses (n ≥ 10). (G) Exemplar inside-out pressure response at 0 mmHg (black) and 50 mmHg (orange). (H) Averaged pressure responses (n ≥ 4). (I) Exemplar TEVC recordings for 30 μM ML335 (purple) activation. (J) ML335 dose-response curves (n ≥ 3). EC50 11.3 ± 3.4 and 12.7 ± 4.1 μM, maximum activation 11.9 ± 1.3, and 3.8 ± 0.4 fold for K2P2.1 (TREK1) and K2P2.1 (TREK1) Y270F, respectively. (K) Exemplar TEVC recordings for 20 μM BL-1249 (blue) activation. (L) Normalized responses to 20 μM BL-1249 (n ≥ 7). (F), (H), (J), and (L) show K2P2.1 (TREK1) (black), K2P2.1 (TREK1) Loop2sym6 (purple), K2P2.1 (TREK1) E234Q (light blue), and K2P2.1 (TREK1) Y270F (orange). “*” and “**” indicate P < 0.05 and P < 0.001, respectively.
