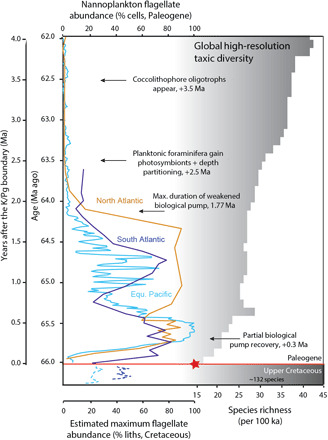
Fig. 3. Fossil nannoplankton abundance of flagellate cells and species richness.

On the left is the percent flagellate cells (24) from sites in the South Atlantic (ODP Site 1262, dark blue), North Atlantic (IODP Sites 1403 and 1407, brown), and the palaeosubequatorial Pacific (ODP Sites 1209 and 1210 and DSDP Site 577, light blue). The percent flagellate cell abundances for the Upper Cretaceous (dashed blue lines) are shown as the percentage of coccolithophores of unknown ecology, of which there may be some flagellate taxa (24), providing us with a maximum possible estimate. The position of the red star indicates our suggestion that all taxa that survived across the K/Pg boundary were capable of phagotrophy. Paired-sample t tests, comparing the percentage of flagellate cells between the early Danian (up to 64.2 Ma) and both the Late Cretaceous and the later Danian (after 64.2 Ma), indicate significant differences between communities in all cases (see table S3). On the right is the high-resolution (number of species present per 100 ka) fossil calcareous nannoplankton species richness (10). Milestones in ecosystem recovery in the post-extinction ocean are indicated (10, 11). Paleogene data are shown against age. The Cretaceous data are a representative uppermost portion, with no high-resolution age assignment (24).
