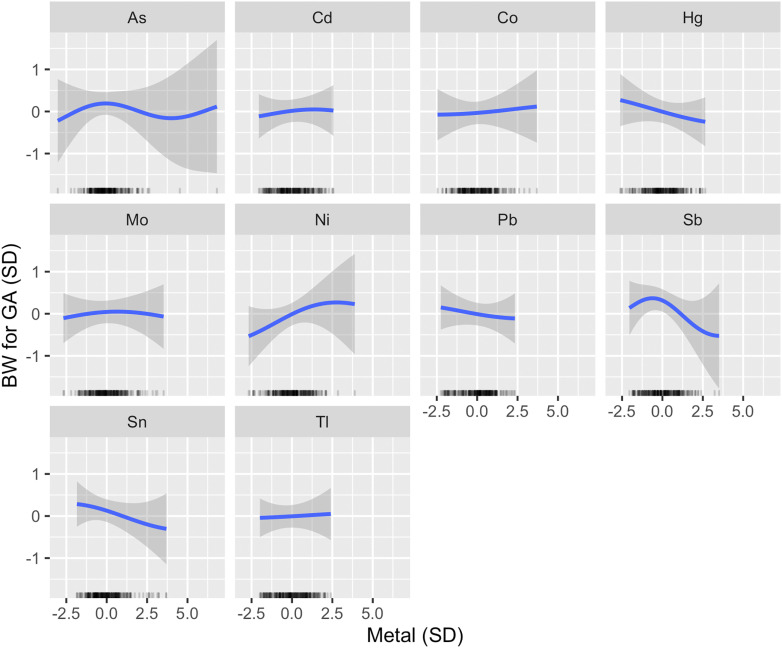
Figure 4.
Univariate exposure–response functions for exploratory analysis (). Associations between each metal and BW for GA z-score (with corresponding 95% credible intervals) are shown setting all other metals to their median, adjusting for maternal age, prepregnancy BMI, recruitment site, race by ethnicity and birth place, any maternal anemia in pregnancy, tobacco smoke exposure in pregnancy, and urinary arsenobetaine (AsB). A rug plot showing the distribution of the specified metal is shown along the x-axis of each panel. Metals and urinary AsB were . Metals and all continuous covariates were also centered and scaled. Note: As, arsenic; BMI, body mass index; BW, birth weight; Cd, cadmium; Co, cobalt; GA, gestational age; Hg, mercury; Mo, molybdenum; Ni, nickel; Pb, lead; Sb, antimony; Sn, tin; Tl, thallium.

