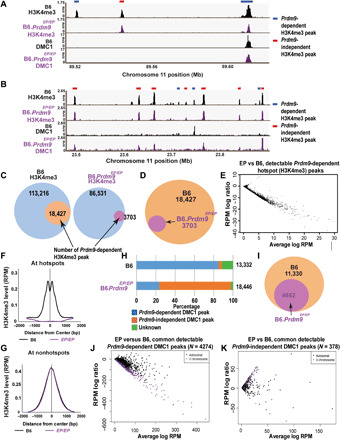
Fig. 1. Prdm9EP alters the Prdm9-dependent H3K4me3 and meiotic DSB landscape in spermatocytes.

(A and B) Genome browser snapshots of H3K4me3 and DMC1 ChIP-seq peaks in wild-type and Prdm9EP/EP (Glu365Pro mutation) spermatocytes. (A) One strong and one weaker PRDM9-dependent hotspot are shown, together with one PRDM9-independent H3K4me3 peak. (B) Several PRDM9-dependent and PRDM9-independent H3K4me3 peaks are shown. Note the shift in DMC1 peaks to PRDM9-independent H3K4me3 peaks in Prdm9EP/EP spermatocytes. (C) Venn diagrams showing the number of detectable PRDM9-dependent H3K4me3 peaks in wild-type (B6) and Prdm9EP/EP spermatocytes. (D) Venn diagram directly comparing the number of detectable PRDM9-dependent H3K4me3 peaks in wild-type and Prdm9EP/EP spermatocytes. (E) MA plot comparing Prdm9EP/EP versus wild-type signal at PRDM9-dependent H3K4me3 peaks that were detectable in Prdm9EP/EP spermatocytes (n = 3703). (F) Aggregation plot showing normalized average signal intensity [reads per million (RPM)] at known PRDM9-dependent H3K4me3 ChIP-seq peaks (n = 18,838) in wild-type and Prdm9EP/EP spermatocytes. (G) Aggregation plot showing normalized average signal intensity (reads per million, RPM) at common nonhotspot H3K4me3 ChIP-seq peaks (n = 79,043) in wild-type and Prdm9EP/EP spermatocytes. (H) Distribution of DMC1 peaks in wild-type and Prdm9EP/EP spermatocytes. (I) Venn diagram comparing the number of PRDM9-dependent DMC1 peaks in wild-type and Prdm9EP/EP spermatocytes. (J and K) MA plots comparing Prdm9EP/EP versus wild-type DMC1 signal at (J) common PRDM9-dependent DMC1 peaks (n = 4724) and (K) common PRDM9-independent DMC1 peaks (n = 378). Black points represent autosomal peaks, and purple points represent peaks on the X chromosome. EP, Glu365Pro change in amino acid sequence.
