
Fig. 4. Chk2 ablation rescues meiosis in Prdm9-null females in the B6 genetic background.
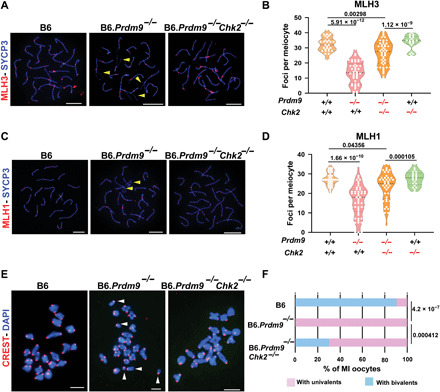
(A and C) Coimmunolabeling detection of MLH3 foci (red, A), MLH1 (red, C), and SYCP3 (blue, both A and C) in pachytene oocyte chromatin spreads from wild-type and mutant females. Yellow arrowheads highlight unsynapsed regions of chromosomes. Scale bars, 10 μm. (B and D) Violin plots with dots showing numbers of MLH3 (B) and MLH1 (D) foci per meiotic oocyte (error bars, SEM). The genotypes of mice tested are indicated below the graphs. P values were calculated using the Mann-Whitney U test with Bonferroni correction for multiple testing. (E and F) Chromosome configuration in meiosis MI analyzed by chromosome spreads from different mutant and control oocytes, pictured in (E) and quantified in (F). In (E), DNA (blue) and kinetochores (red) were detected by DAPI and CREST antiserum, respectively. Scale bars,10 μm. Multiple univalents in a B6.Prdm9−/− oocyte are indicated with white arrowheads. The examples of oocytes from B6 and B6.Prdm9−/−Chk2−/− mice reveal all chromosomes organized in bivalents. P values were calculated using χ2 test.