
Fig. 5. SPOTlight screening identified a YFP with up to fivefold improvement in photostability.
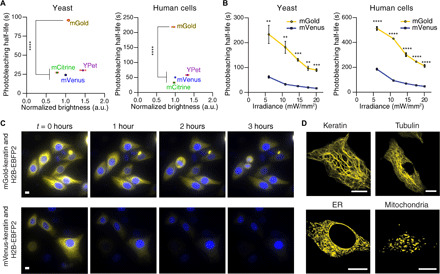
(A and B) In cellulo characterization of mGold, the best YFP variant identified from screening. (A) mGold was more photostable than commonly used YFPs and exhibited similar brightness. Cells were photobleached with 508/25-nm light at 20 mW/mm2. YFP brightness was normalized for cell-to-cell differences in protein expression (YFP/BFP). The square markers indicate the means from six yeast cultures or six independent transfections. For each replicate, the mean photobleaching half-life and brightness of several hundred yeast or human cells were determined. The error bars represent the SEM. P ≤ 0.0001 for Welch’s analysis of variance (ANOVA) for both yeast and human cell data. ****P ≤ 0.0001 for Dunnett’s T3 post hoc test. (B) mGold is more photostable than mVenus over a range of irradiance levels. The mean photobleaching half-lives were computed from three yeast cultures or three independent transfections per irradiance level. For each replicate, the mean photobleaching half-life of several thousand yeast cells or hundreds of human cells was determined. The error bars represent the SEM. P = 0.013 (yeast) and ≤ 0.0001 (human cells) for t tests comparing the areas under the curve. **P ≤ 0.01, ***P ≤ 0.001, and ****P ≤ 0.0001 for t tests corrected for multiple comparisons with the Holm-Šídák method. (C) Time-lapse imaging experiment of representative HeLa cells expressing a fusion of keratin with mGold (top) or mVenus (bottom). Nuclei were identified by coexpressing a fusion of H2B and EBFP2. Cells were imaged every 30 s for 3 hours. Scale bars, 20 μm. (D) Expressing fusions of mGold and subcellular localization tags produced the expected pattern of fluorescence in HeLa cells. ER, endoplasmic reticulum. Scale bars, 10 μm.