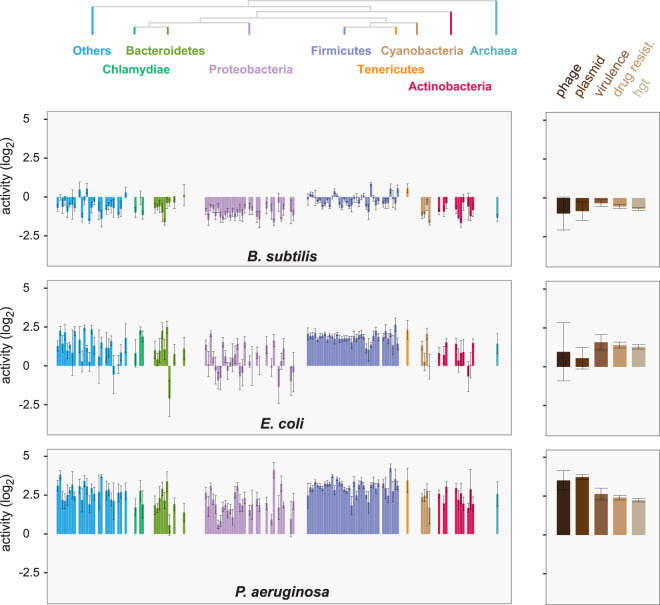
Fig. 1. Phylogenetic trends in RE library expression.
Mean transcription activities of regulatory elements from diverse genomes (left) and mobile DNA (right) are shown across the three distinct recipients as bar plots. Values represent the mean activity of REs from individual genomes and are normalized to endogenous reference sequences (“Methods”). Higher transcription is generally observed in P. aeruginosa compared with E. coli and B. subtilis. The donor phylogeny or library type is represented on the top, each bar represents one distinct donor. Error bars are two standard errors from the mean. Library represents 1859 (genomic) + 281 (mobile) REs that are informative in all recipients (RNA + DNA counts > 15) and at least 1 read of RNA and DNA. Only genomes with at least 3 informative RE measurements are displayed.

