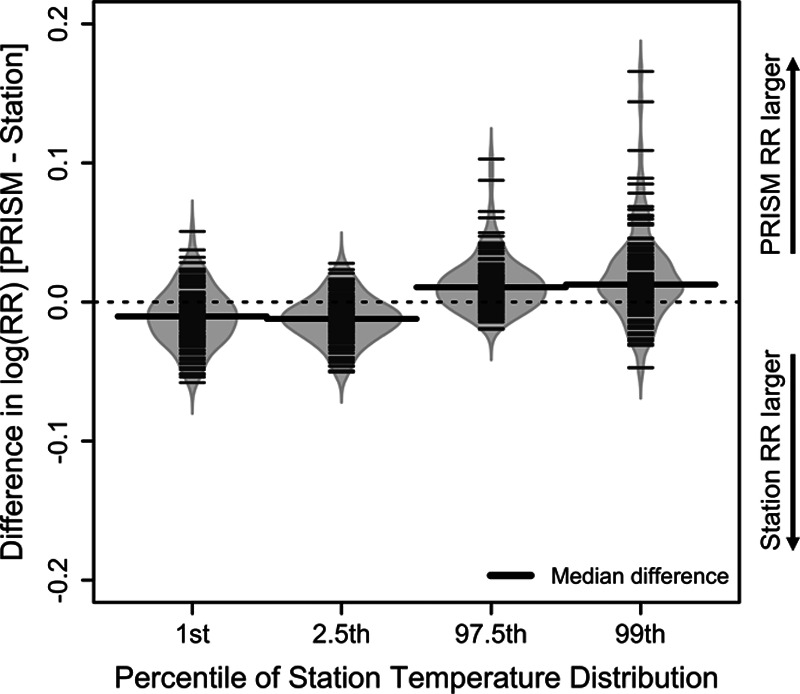
Figure 4.

Distribution of the difference between the log(RR) for the 21-day cumulative association between temperature and mortality as estimated using PRISM versus station temperature in each of 113 counties. In each county, differences are calculated for the log(RR) at four values of temperature (i.e., the 1st, 2.5th, 97.5th, and 99th percentile of that county’s weather station temperature distribution) versus the minimum mortality temperature. Differences are calculated such that counties where the PRISM curve yields a larger estimate of the temperature-mortality association receive a positive value.
