
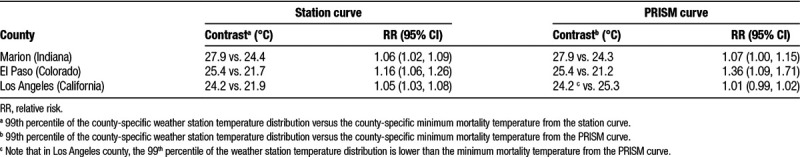
Table 1.
RR of death (95% CI) at the 99th percentile of the weather station temperature distribution versus the minimum mortality temperature, shown for both the station curve and the PRISM curve in each of three example counties
Official websites use .gov
A
.gov website belongs to an official
government organization in the United States.
Secure .gov websites use HTTPS
A lock (
) or https:// means you've safely
connected to the .gov website. Share sensitive
information only on official, secure websites.
RR of death (95% CI) at the 99th percentile of the weather station temperature distribution versus the minimum mortality temperature, shown for both the station curve and the PRISM curve in each of three example counties