
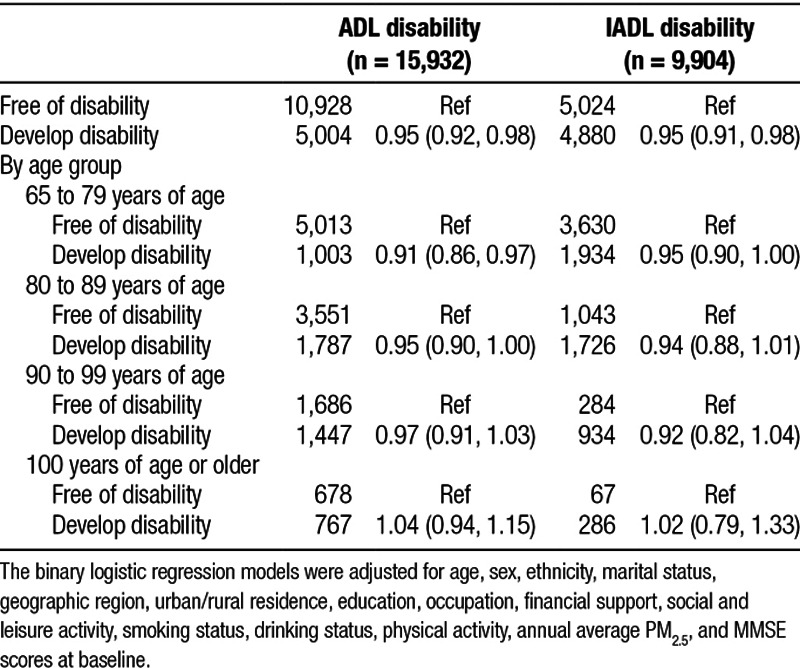
Table 3.
Odds ratios and 95% CI for per 0.1-unit increase in baseline annual average NDVI and development of ADL and IADL disabilities among healthy participants at baseline
Official websites use .gov
A
.gov website belongs to an official
government organization in the United States.
Secure .gov websites use HTTPS
A lock (
) or https:// means you've safely
connected to the .gov website. Share sensitive
information only on official, secure websites.
Odds ratios and 95% CI for per 0.1-unit increase in baseline annual average NDVI and development of ADL and IADL disabilities among healthy participants at baseline