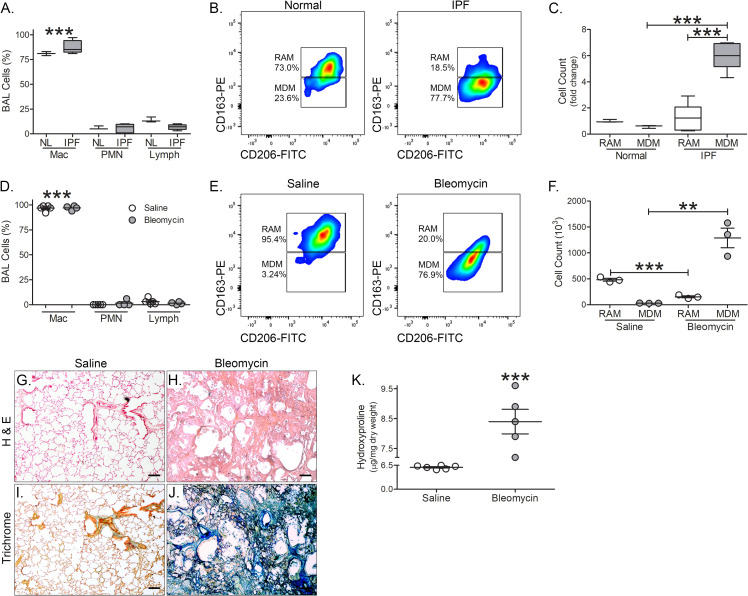
Fig 1. Recruited monocyte-derived macrophages from tree shrews are increased during fibrosis.
(A) Cell differential of normal (n = 3) and IPF (n = 5) subjects. (B) Representative flow cytometry plots of monocyte-derived macrophages (MDM, CD11b+HLA-DR++CD206++CD169+CD163+) and resident alveolar macrophages (RAM, CD11b+HLA-DR++CD206++CD169+CD163++) of normal (n = 3) and IPF (n = 5) subjects. (C) Total cell number of RAM and MDM from BAL of normal (n = 3) and IPF (n = 5) subjects expressed as fold change. (D) Cell differential of saline- (n = 5) and bleomycin-exposed (n = 4) tree shrews. (E) Representative flow cytometry plots of monocyte-derived macrophages (MDM, CD11b+HLA-DR++CD206++CD169+CD163+) and resident alveolar macrophages (RAM, CD11b+HLA-DR++CD206++CD169+CD163++) of saline- (n = 3) and bleomycin-exposed (n = 3) tree shrews. (F) Total cell number of RAM and MDM from BAL saline- (n = 3) and bleomycin-exposed (n = 3) tree shrews. Representative H & E staining of lung tissue from (G) saline- (n = 6) and (H) bleomycin-exposed (n = 5) tree shews. Masson’s Trichome staining of lung tissue from (I) saline- (n = 6) and (J) bleomycin-exposed (n = 5) tree shews. Scale bar = 100 μm for G-J. (K) Hydroxyproline analysis of saline- (n = 6) and bleomycin-exposed (n = 5) tree shrews. **, p < 0.001; ***, p < 0.0001. Values shown as mean ± S.E.M. Two-way ANOVA with Tukey post-test was utilized for (A), (C), (D), and (F). Two-tailed t-test statistical analysis was utilized for (K).

