
Figure 3.
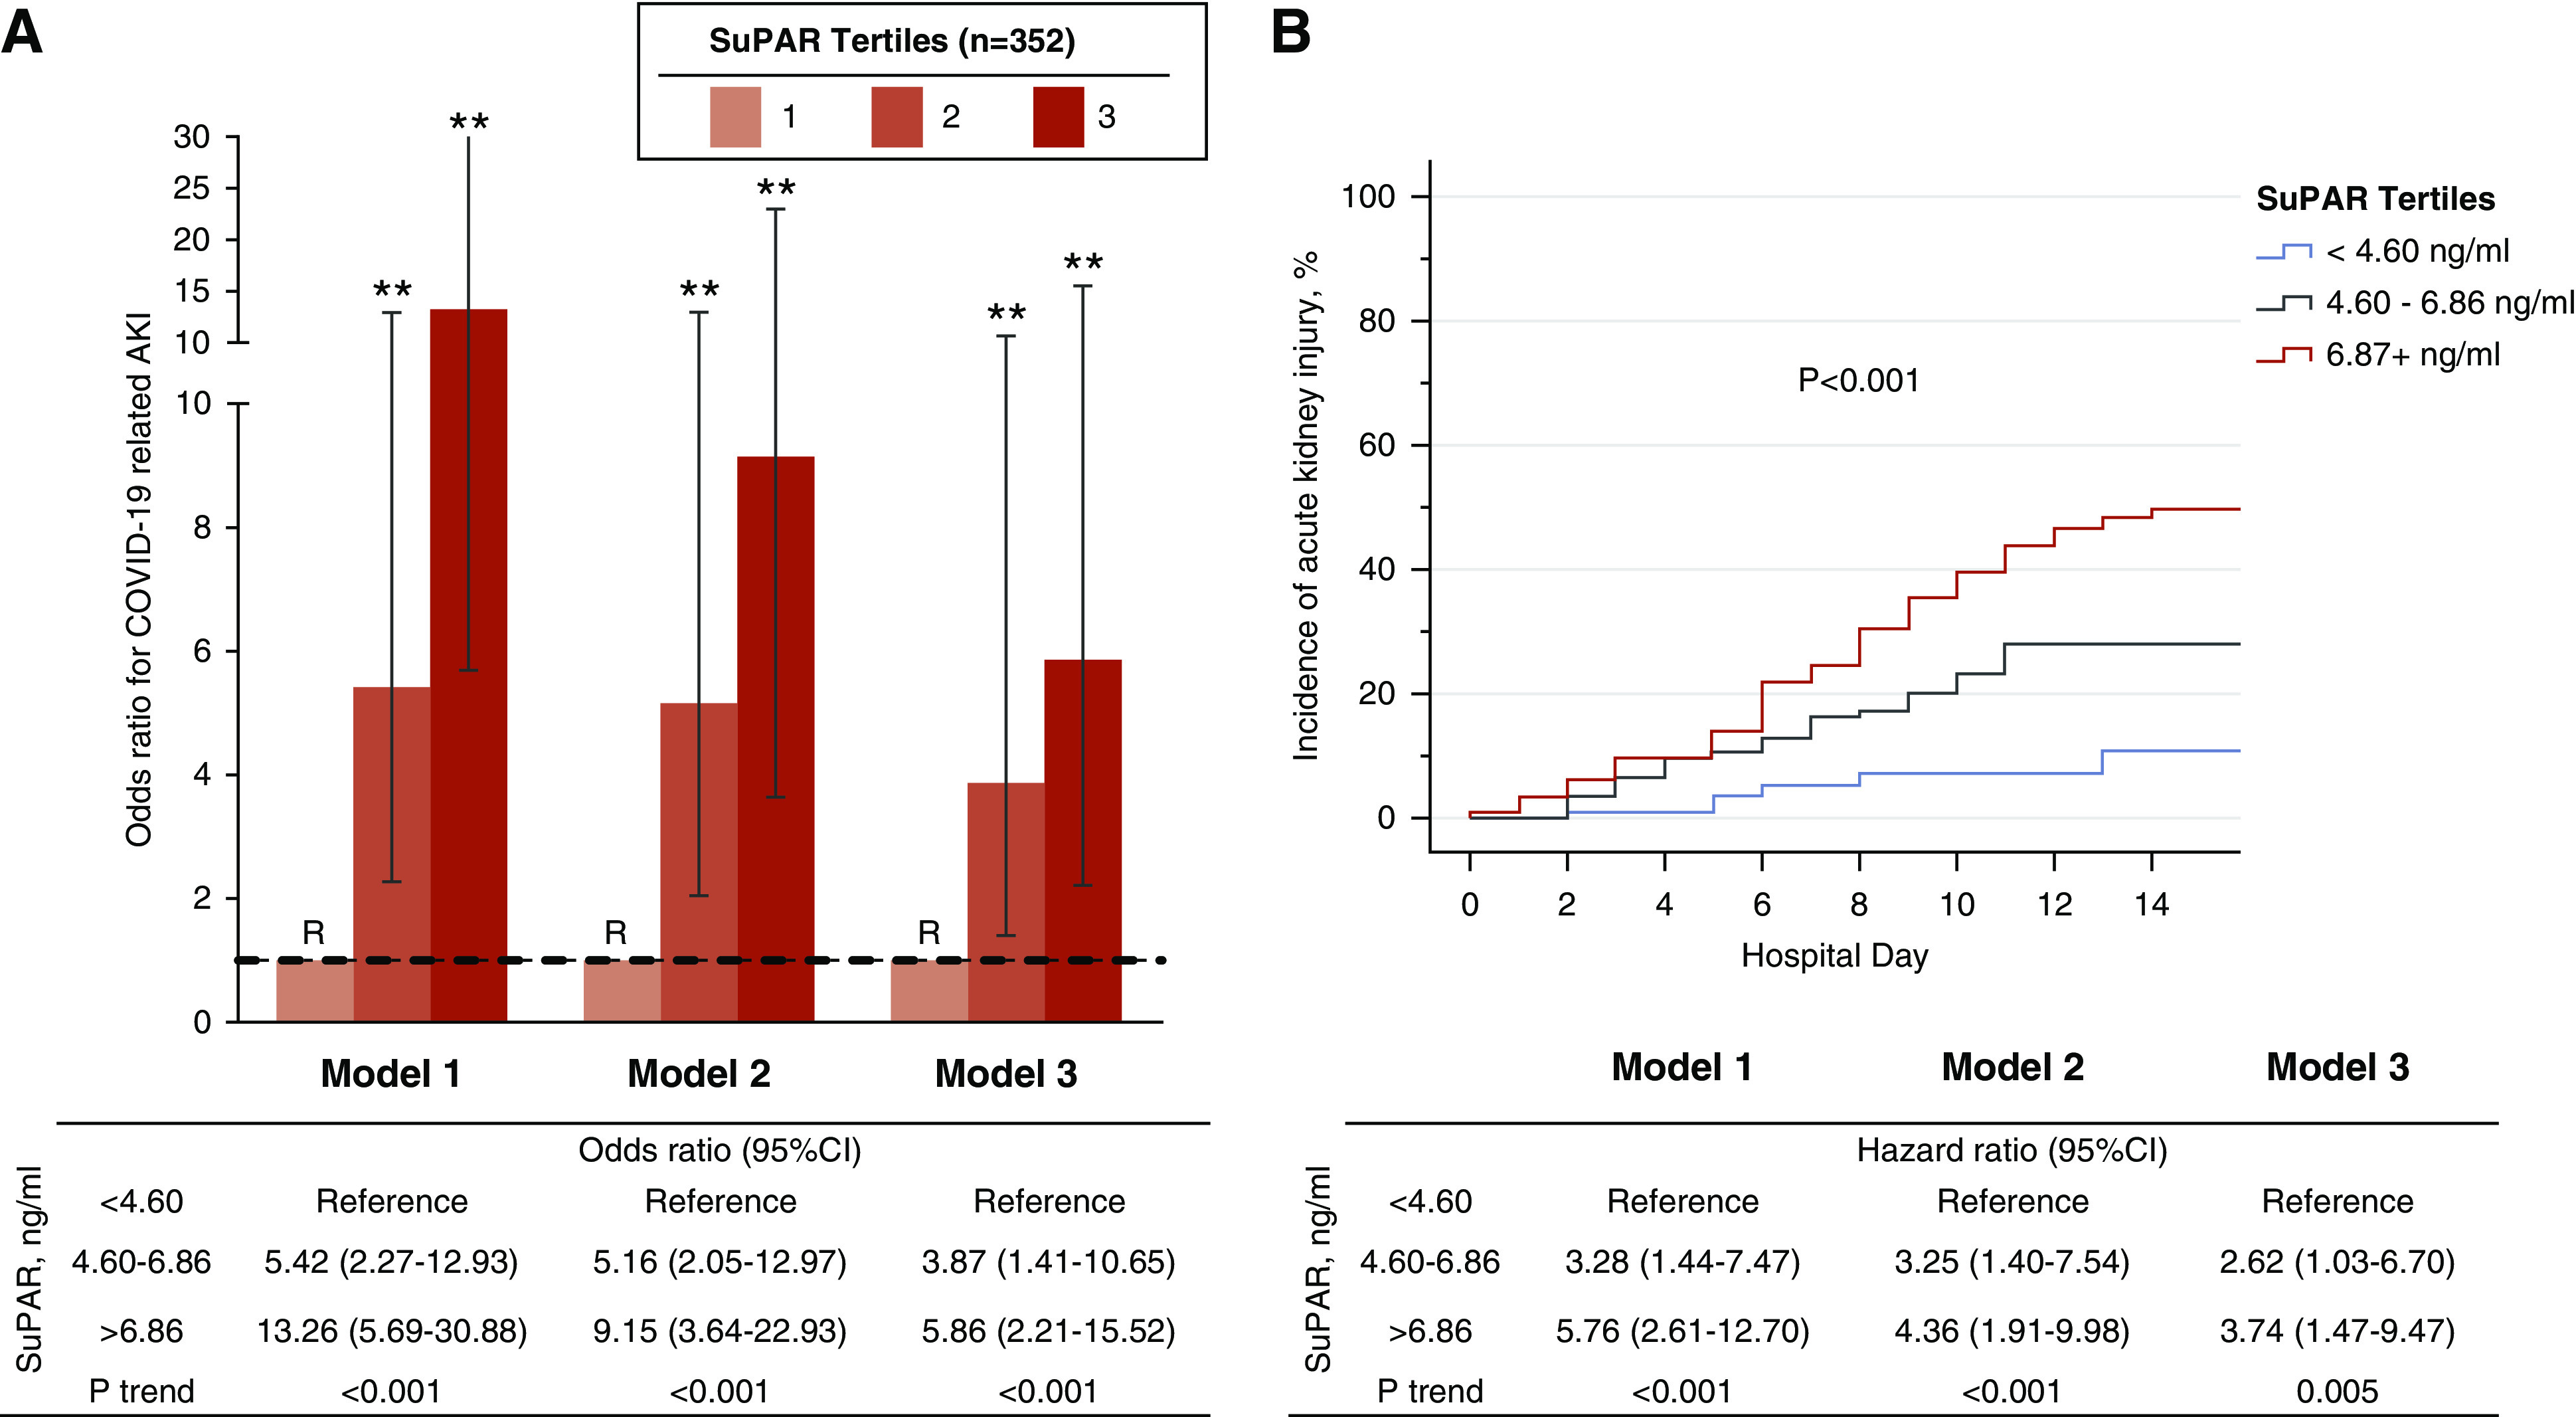
SuPAR and odds of COVID-19–related AKI. (A) Bar graph depicting ORs and 95% CIs for AKI according to admission suPAR tertiles. (B) Kaplan–Meier curves showing cumulative incidence of AKI stratified by suPAR tertiles with log-rank P value. Cox regression modeling hazard ratios are reported in the accompanying table. Model 1 was unadjusted. Model 2 was adjusted for age, sex, race, diabetes mellitus, hypertension, and eGFR at the time of sample collection for suPAR. Model 3 incorporated the aforementioned variables including oxygen saturation and CRP levels. Tertile 1 was the reference (R) group in all models. **P<0.001. Data for model 3 were available in 301 participants.