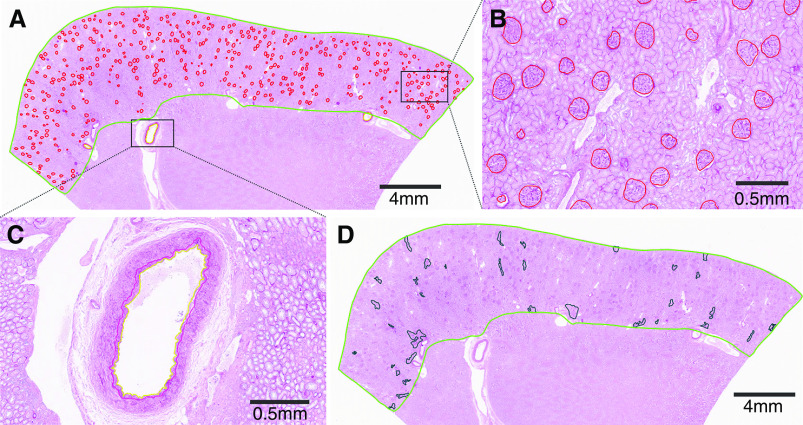
Figure 2.
Morphometry was performed on wedge sections. (A) An example of a periodic acid–Schiff-stained wedge section, with cortex outline in green trace. (B) Nonsclerotic glomeruli (red trace) and GSG were traced manually. (C) An example of an artery with labeled media to intima boundary (red trace) and intima to lumen (yellow trace) to quantify percentage luminal stenosis. (D) Percentage interstitial fibrosis (black trace) was assessed in the whole cortex.

