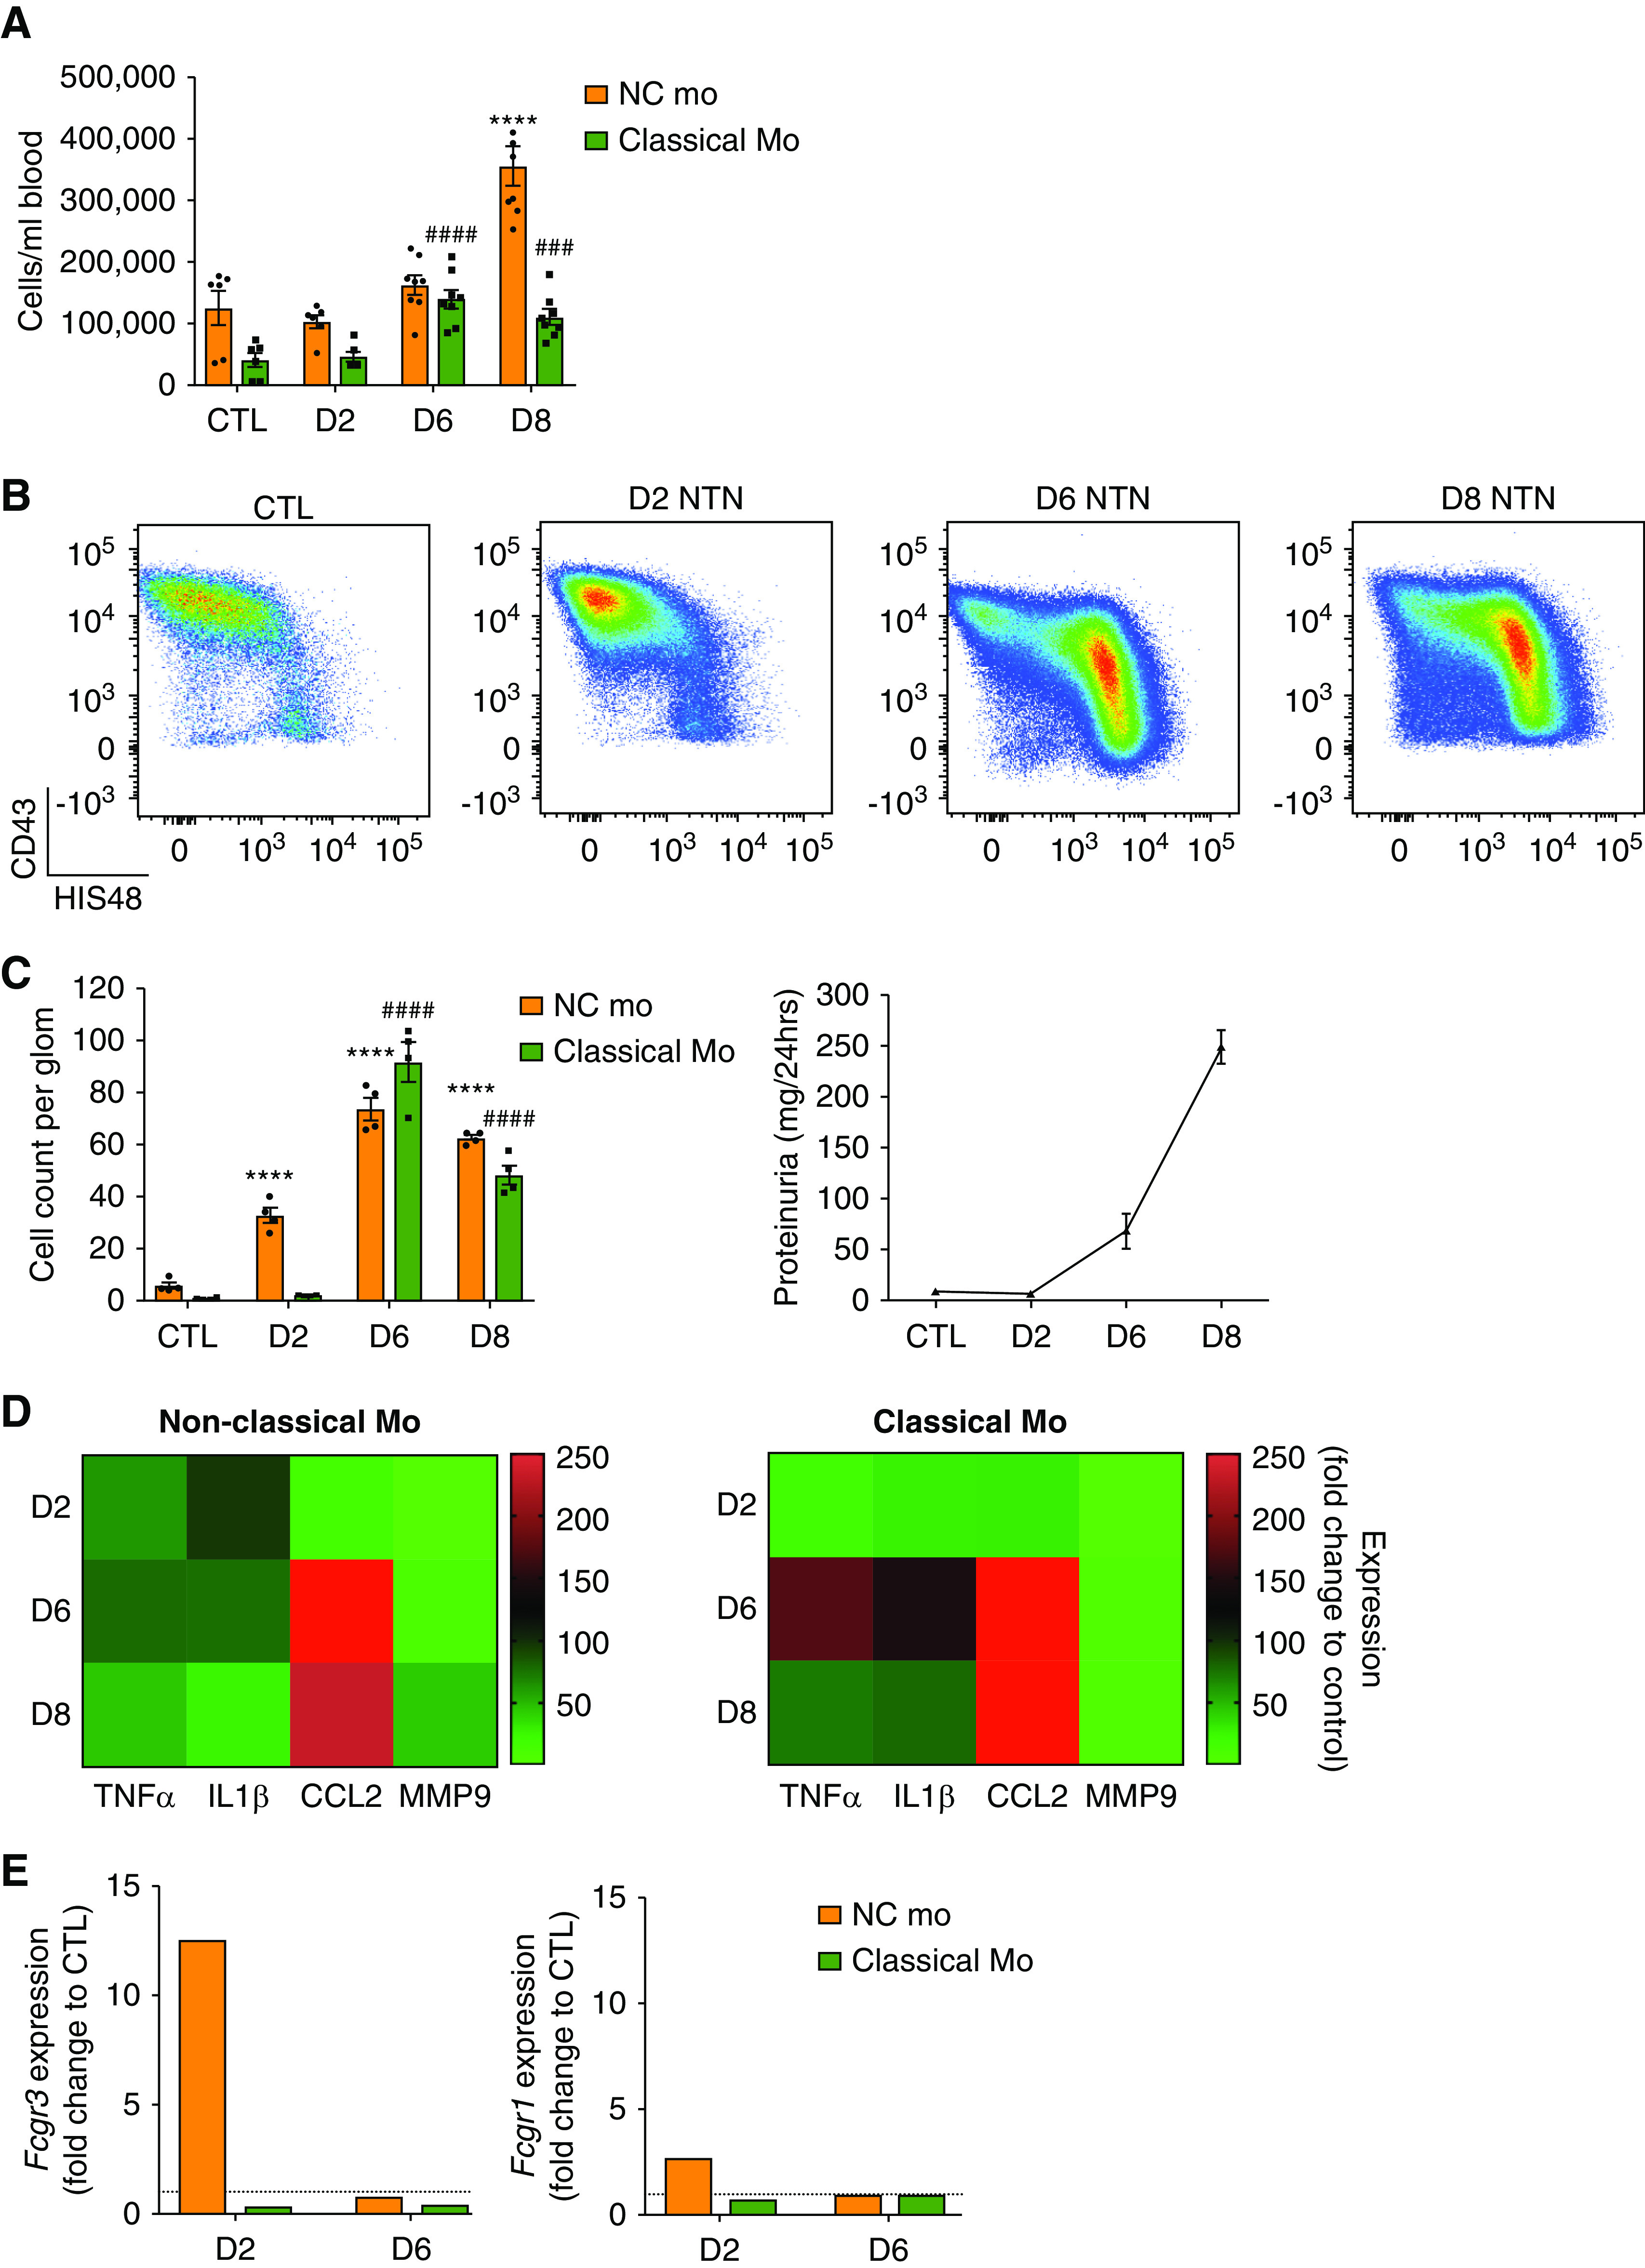
Figure 2.

Two waves of monocyte subset recruitment during NTN with distinct effector functions (A) Blood cell counts of monocyte subsets from WKY-hCD68-GFP rats over time with NTN, compared with control (mean±SEM, n=6). ####P<0.001; ###/***P<0.001 relative to respective control population, by ANOVA with Sidak multiple comparisons test. n=6–8 rats per group from two separate experiments. See also Supplemental Figure 4A. (B and C) Ex vivo analysis of glomerular monocyte recruitment during NTN. Glomerular isolates sieved from whole kidneys taken from WKY-hCD68-GFP rats were digested to obtain single-cell suspensions, which were analyzed by flow cytometry. (B) Representative dot plots of monocyte subpopulations in control rats and at each NTN time point are shown and (C) counting beads were used to obtain cell counts per glomerulus at different time points during NTN, compared with control rats. (C) also illustrates proteinuria during NTN, highlighting that onset of proteinuria on day 6 NTN correlates with significant increase in infiltration of glomerulus with classical monocytes. Graphs show mean±SEM. ****/####P<0.001 relative to respective control population, by two-way ANOVA with Dunnett multiple comparisons test. n=4 rats per group from two separate experiments. (D) Heat map summarizing gene expression proinflammatory mediators, analyzed by qPCR, in non-classical and classical monocytes sorted from glomeruli of WKY-hCD68-GFP rats with NTN using FACS. Fold change expression relative to PBMCs from control WKY-hCD68-GFP rats illustrated. Complementary DNA for each time point pooled from n=4 rats; samples were run in triplicate. (E) Gene expression, analyzed by qPCR, of low-affinity FcγRIII (CD16) and high-affinity FcγRI (CD64) in non-classical and classical monocytes sorted from glomeruli of WKY-hCD68-GFP rats with NTN using FACS. Fold change expression relative to PBMCs from control WKY-hCD68-GFP rats illustrated. Complementary DNA from for each time point pooled from n=2 rats; samples were run in triplicate. See also Supplemental Figure 5. Classical Mo, classical monocytes; CTL, control (no NTN); D2, day 2 NTN; D6, day 6 NTN; D8, day 8 NTN; NC Mo, non-classical monocytes.
