Figure 3.

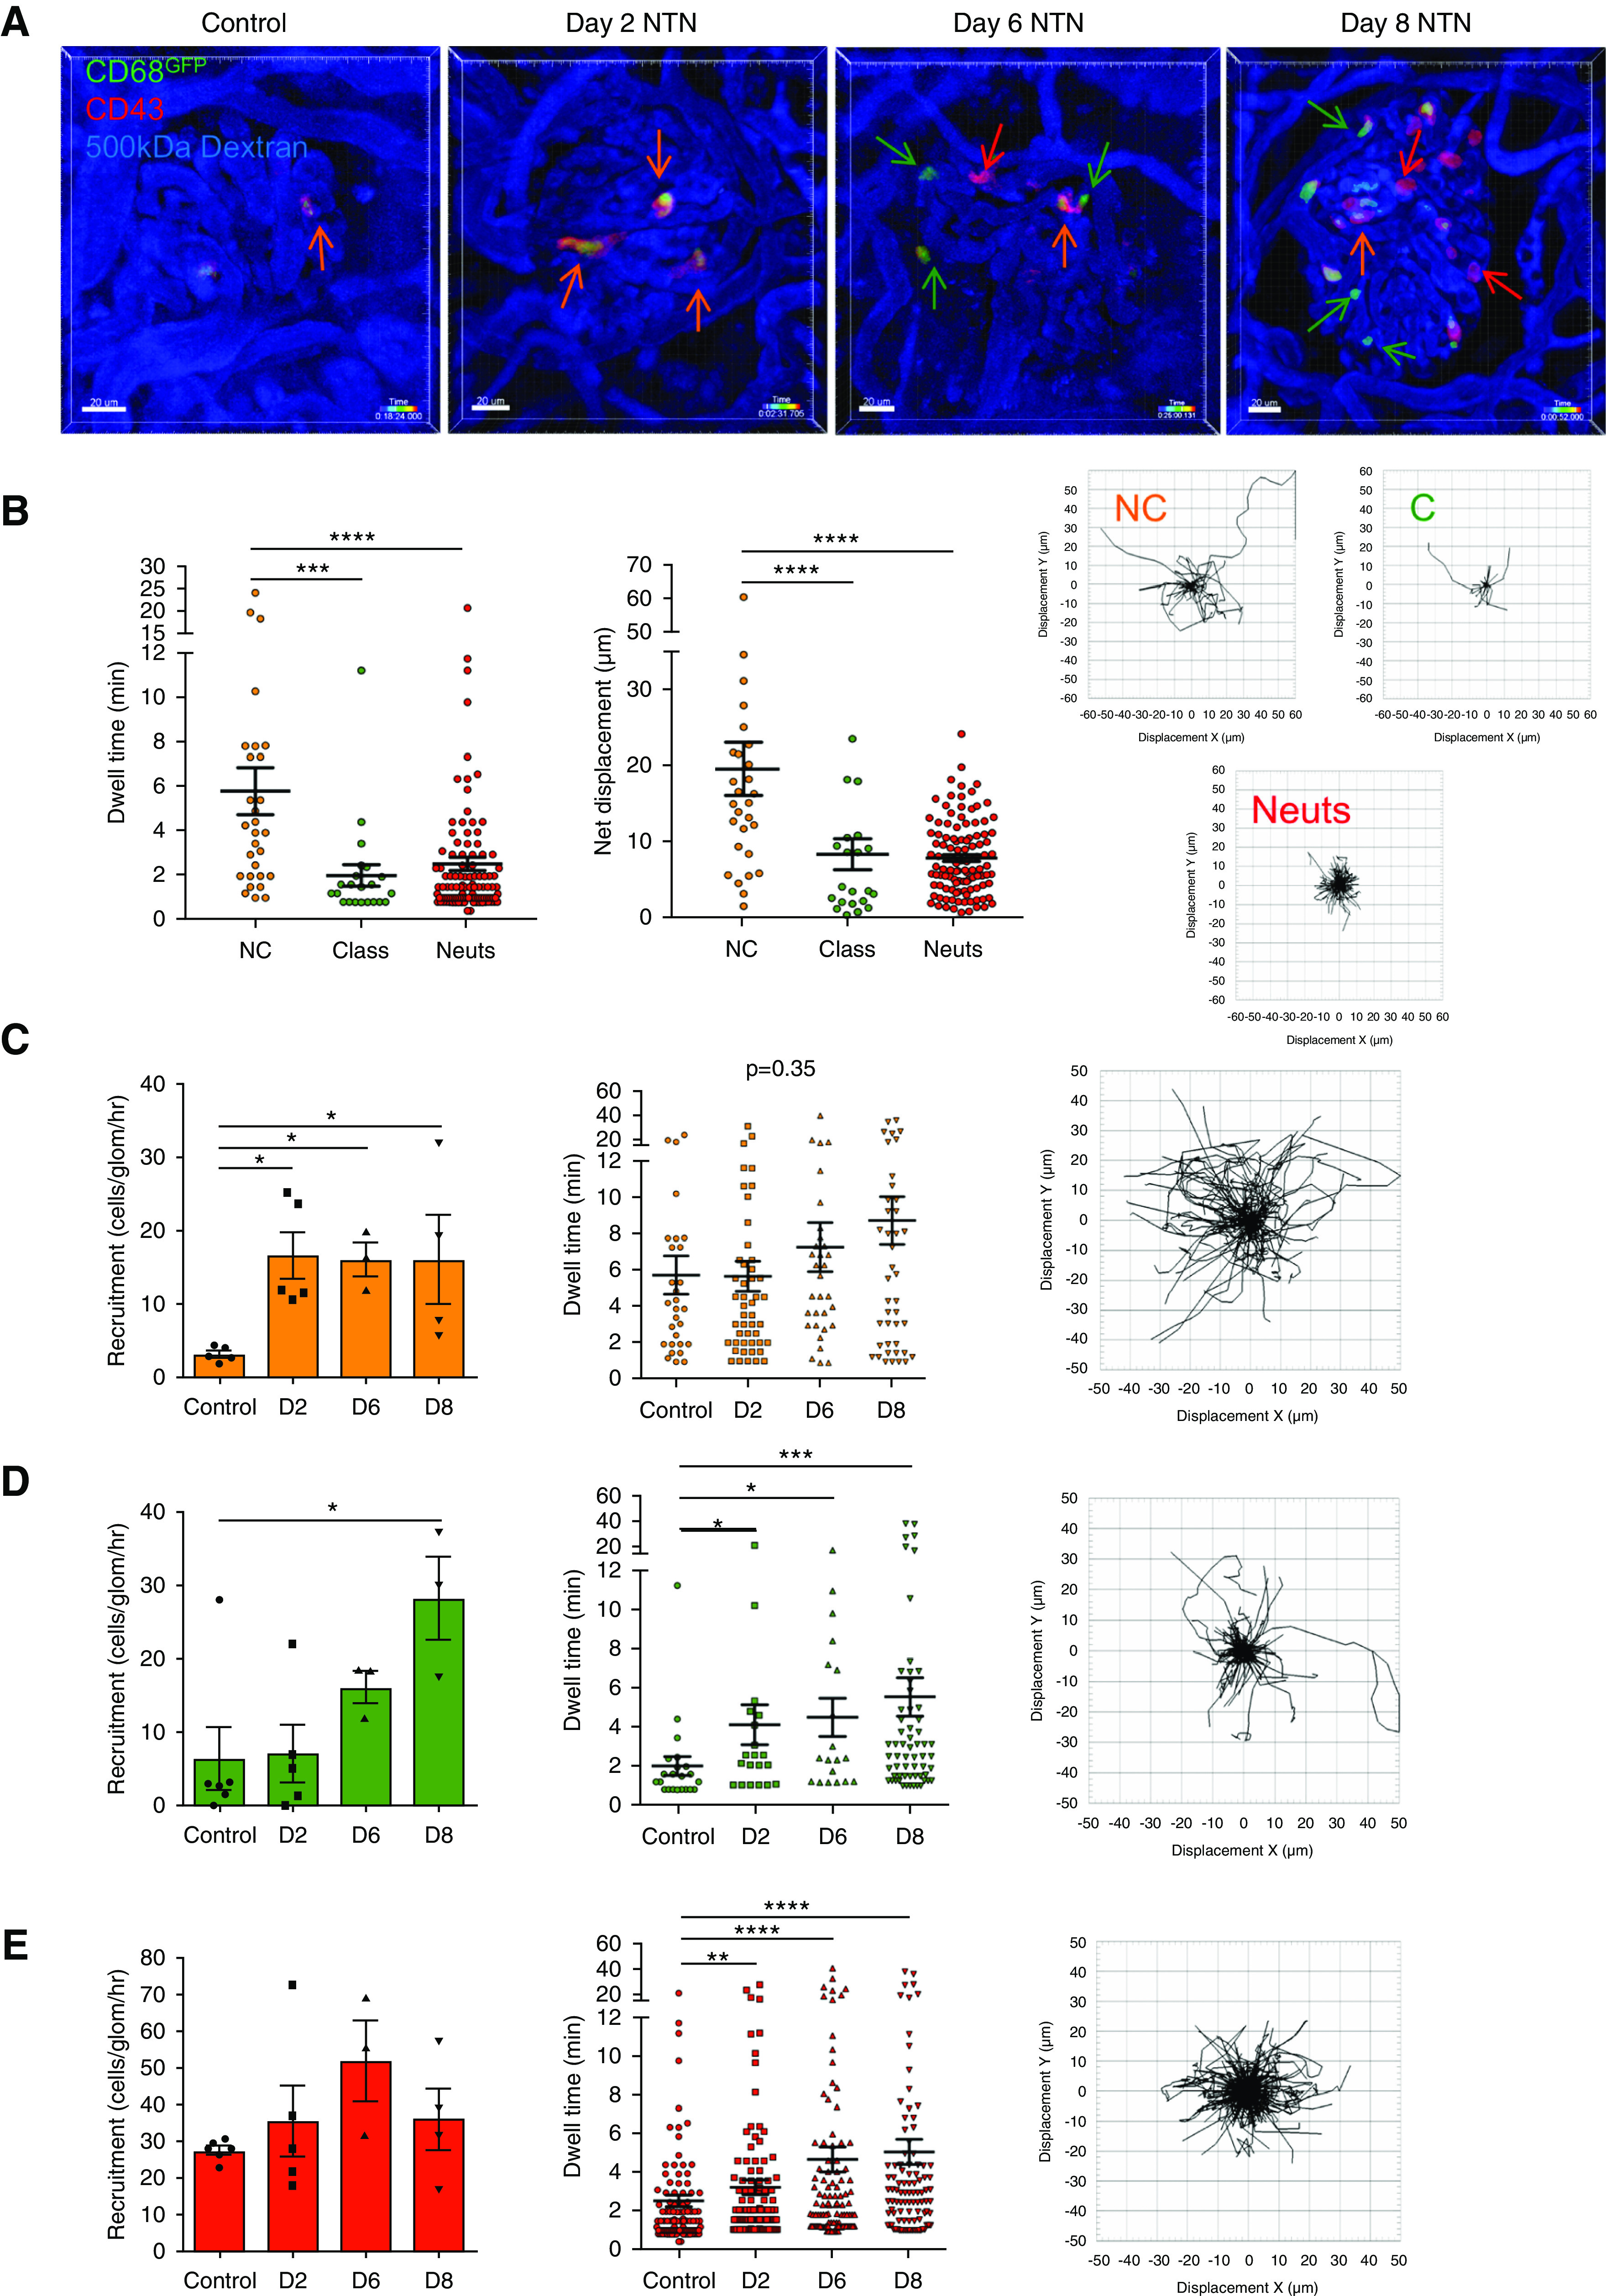
Live glomerular imaging reveals distinct responses of leukocyte subpopulations to immune complex formation within glomerular capillary walls. (A) In vivo antibody labeling with intravenous injection of anti-rat CD43–Alexa Fluor 647 during live glomerular imaging in WKY-hCD68-GFP transgenic rats enables three distinct leukocyte subpopulations to be labeled and tracked in real-time in vivo. Representative still frames from time-lapse imaging shown (scale bars, 20 μm). Orange arrows identify GFPposCD43pos non-classical monocytes, green arrows identify GFPposCD43neg classical monocytes, and red arrows identify GFPnegCD43pos neutrophils. See Supplemental Video 2, A–D. In a separate experiment anti-rat granulocyte antibody HIS48 was injected intravenously to visualize GFPnegHIS48pos neutrophils. This confirmed that the majority of GFPnegCD43pos cells retained within glomerular capillaries during NTN colabel with HIS48, and hence most likely represent neutrophils (see Supplemental Video 3). (B) GFPposCD43pos non-classical monocytes, GFPposCD43neg classical monocytes (Class), and GFPnegCD43pos neutrophils (Neuts) were identified and tracked in postacquisition imaging analysis to determine the duration of their retention within glomerular capillaries (dwell time) and their net displacement in control WKY-hCD68-GFP rats. Displacement track plots of glomerular myeloid populations in the steady state also illustrated (displacement X, μm versus displacement Y, μm plotted, starting position of all tracks aligned at center). Graphs show mean±SEM. ****P<0.001; ***P<0.001, by Kruskal–Wallis with Dunn multiple comparisons test. (C–E) Recruitment, duration of retention (dwell time), and displacement track plots for (C) GFPposCD43pos non-classical monocytes, (D) GFPposCD43neg classical monocytes, and (E) GFPnegCD43pos neutrophils on days 2, 6, and 8 NTN versus controls. All graphs show mean±SEM. *P<0.05; **P<0.01; ***P<0.001; ****P<0.001 versus control, by ANOVA with Holm–Sidak multiple comparisons test for recruitment, and Kruskal–Wallis with Dunn multiple comparisons test for dwell time. A mean of five glomeruli from at least two separate experiments were analyzed for each time point. Each glomerulus imaged for 30–45 minutes. Track plots illustrate leukocyte tracks generated from all time points after aligning their starting positions at the center of the plot (displacement X, μm versus displacement Y, μm plotted). D2, day 2 NTN; D6, day 6 NTN; D8, day 8 NTN.
