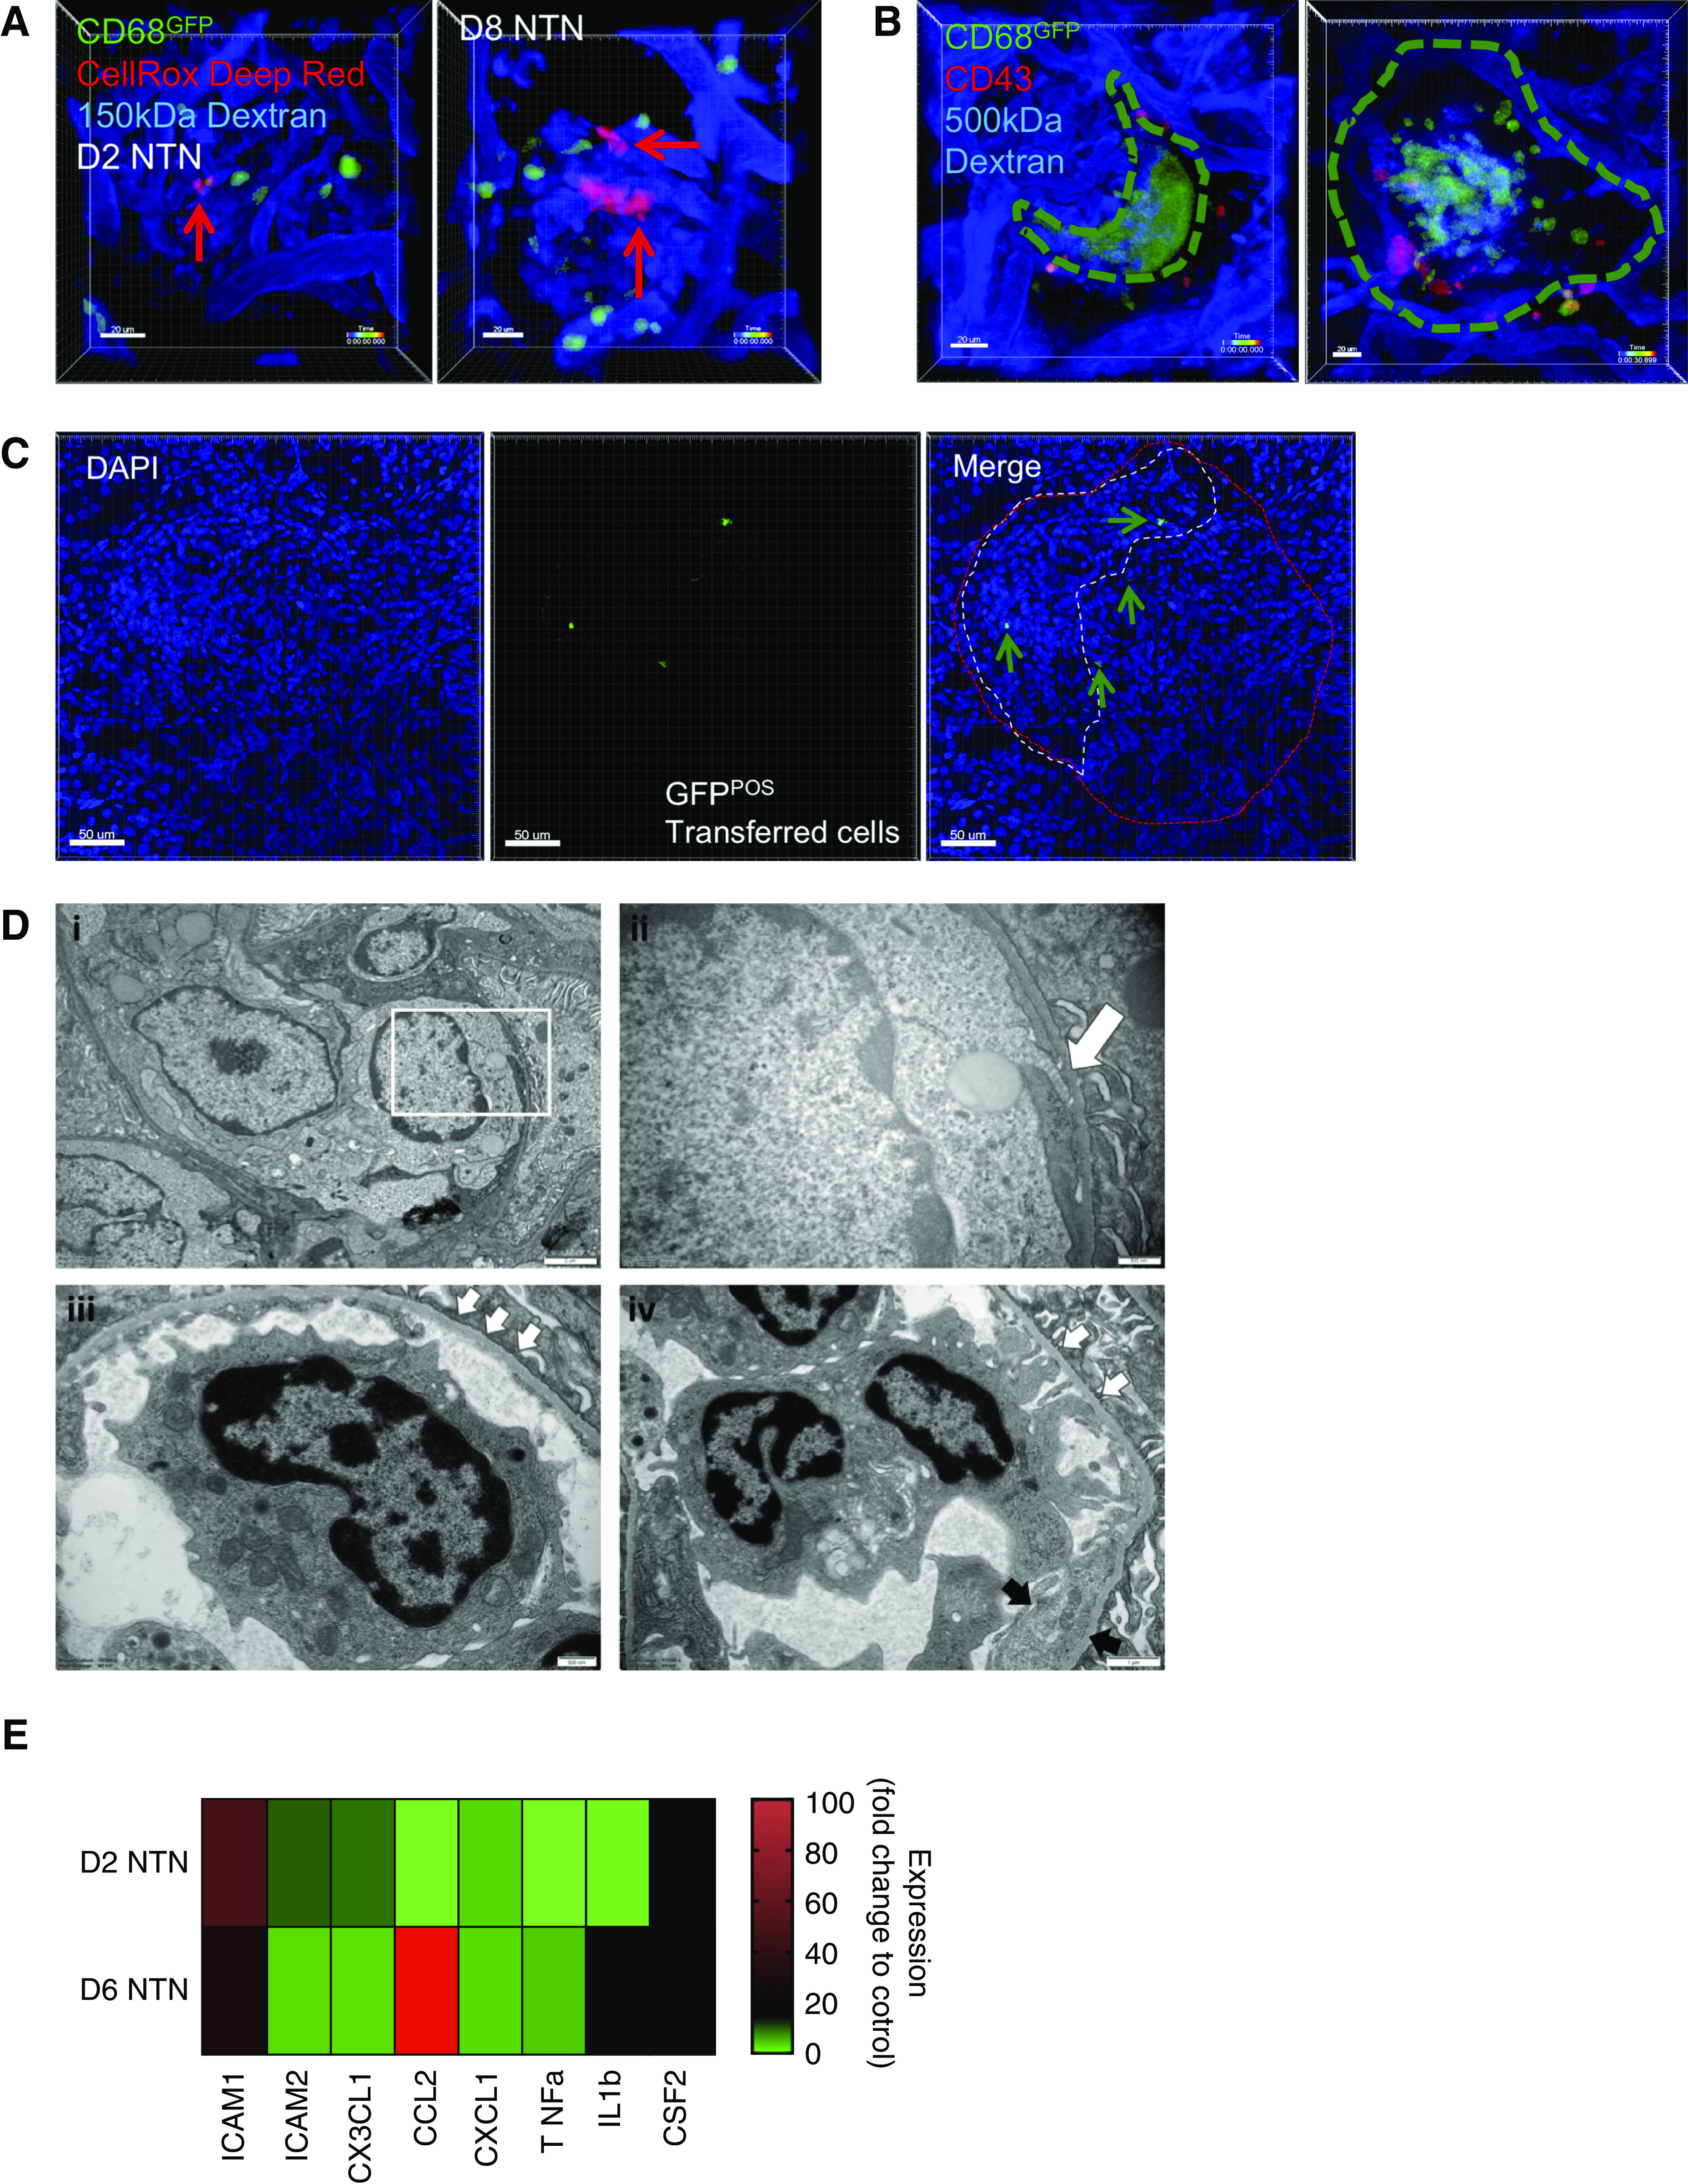
Figure 5.

Retained glomerular leukocytes produce ROS during NTN, which may contribute to endothelial inflammation/damage and crescent formation via subendothelial pseudopodia projections. (A) Snapshots of videos (see Supplemental Video 4, A and B) from WKY-hCD68-GFP rats with day 2 (left) and day 8 (right) NTN in which CellRox Deep Red was injected intravenously during intravital glomerular imaging to detect ROS production (red signal) in real time. Red arrows identify ROS positive cells. Scale bars, 20 μm. (B) Live imaging of glomerular crescents performed in WKY-hCD68-GFP rats with day 10 NTN. In vivo antibody labeling with anti-CD43–Alexa Fluor 647 antibody used to label myeloid subpopulations, as in Figure 3. Two snapshots of videos illustrated (see Supplemental Video 5, A and B). Dotted line indicates outline of crescent. Two representative examples of crescents shown: large dynamic GFP aggregate forming typical crescent shape around glomerular tuft (left, Supplemental Video 5A) and more cellular structure with GFPpos monocytes seen within Bowman’s space (right, Supplemental Video 5B). Scale bars, 20 μm. (C) Representative adoptive transfer experiments. A pool of GFPpos monocytes were sorted from donor WKY-hCD68-GFP rats and injected intravenously into wild-type WKY rats on day 8 NTN. Wild-type WKY recipient rats were euthanized 24 hours later and frozen tissue sections were examined using confocal microscopy. GFPpos cells near to and within crescent areas were clearly identified (arrows). Representative glomeruli from two experiments. Scale bars, 50 μm. (D) Ultrastructural examination illustrating the contribution of endothelial cells to glomerular inflammation during NTN: kidney tissue sections obtained at day 6 NTN. (i) Capillary lumina are filled with leukocytes and there is endothelial cell swelling (magnification ×8000). (ii) Intravascular monocytes extend pseudopodia (white arrow) beneath the endothelial cells and come into direct contact with the glomerular basement membrane and hence, presumably, immune complexes [magnified image of the white box in (i), final magnification ×25,000]. (iii) An area of basement membrane denudation is demonstrated with three small white arrows (magnification ×16,500). (iv) An intraluminal monocyte establishes contacts with the basement membrane (white arrows) in areas of glomerular basement membrane denudation. Adjacent endothelium shows increased cytoplasm and loss of fenestrations (black arrows, endothelial cell enlargement) (magnification ×11,500). (E) Glomerular endothelial cells were sorted from glomerular digests of WKY rats with days 2 and 6 NTN using FACS, and gene expression analyzed using qPCR. Multiple gene targets represented. Fold change expression relative to control kidney endothelium from WKY rats. cDNA for each time point pooled from n=2 rats, samples run in triplicate. See also Supplemental Figure 5E for endothelial cell gating strategy.
