Figure 6.
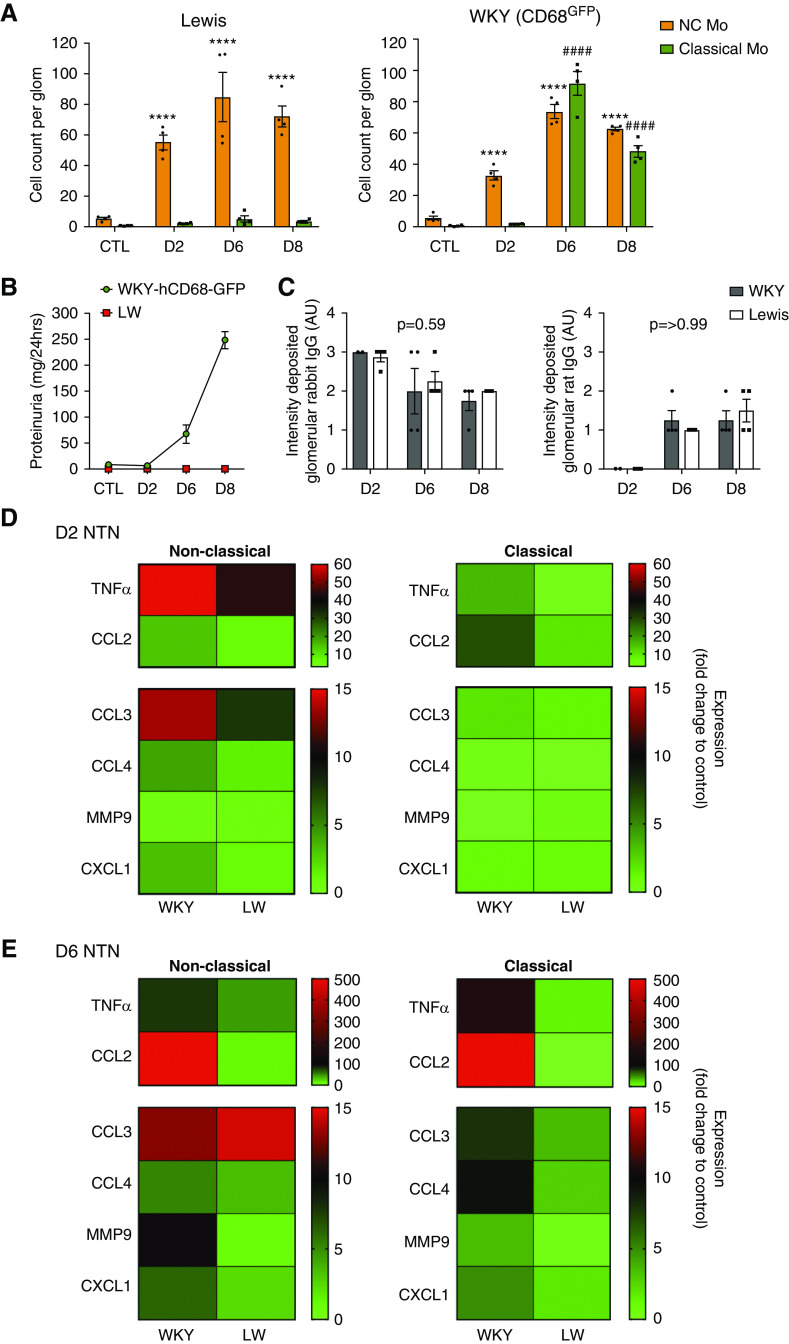
Immune complex detection by non-classical monocytes may occur through activating FcγRIII (CD16). (A) Ex vivo analysis of glomerular monocyte recruitment during NTN in Lewis rats, compared with WKY-CD68-GFP rats previously shown in Figure 2C. Glomerular isolates were sieved from whole kidneys taken from Lewis rats, digested to obtain single-cell suspensions, and analyzed by flow cytometry (see also Supplemental Figure 6B). Counting beads were used to obtain cell counts per glomerulus at different time points during NTN in Lewis rat strain and compared with WKY-hCD68-GFP rat strain. Graphs show mean±SEM. ****/####P<0.001, relative to respective control population, by two-way ANOVA with Dunnett multiple comparisons test. n=4 rats per group. (B) Proteinuria in Lewis and WKY rats during NTN compared with control. (C) Intensity of glomerular capillary wall deposition of rabbit (left graph) and rat (right graph) IgG analyzed by direct immunofluorescence on frozen kidney sections. Lewis and WKY rat strains compared by two-way ANOVA with Sidak multiple comparisons test. See also Supplemental Figure 7. (D and E) Heat map summarizing gene expression, analyzed by qPCR, in CD43hiHIS48int non-classical and CD43loHIS48hi classical monocytes sorted from glomeruli of WKY-hCD68-GFP and Lewis rats on (D) day 2 NTN and (E) day 6 NTN, using FACS. Multiple gene targets represented. For all targets except CXCL1, fold change expression relative to PBMCs from control WKY-hCD68-GFP rats is illustrated. For CXCL1, fold change expression relative to Lewis non-classical monocytes on day 2 NTN is illustrated (target not expressed in control PBMCs). Complementary DNA for each time point pooled from n=4 rats; samples were run in triplicate. See also Supplemental Figures 6 and 7. CTL, control; D2, day 2 NTN; D6, day 6 NTN; D8, day 8 NTN; LW, Lewis rats.

