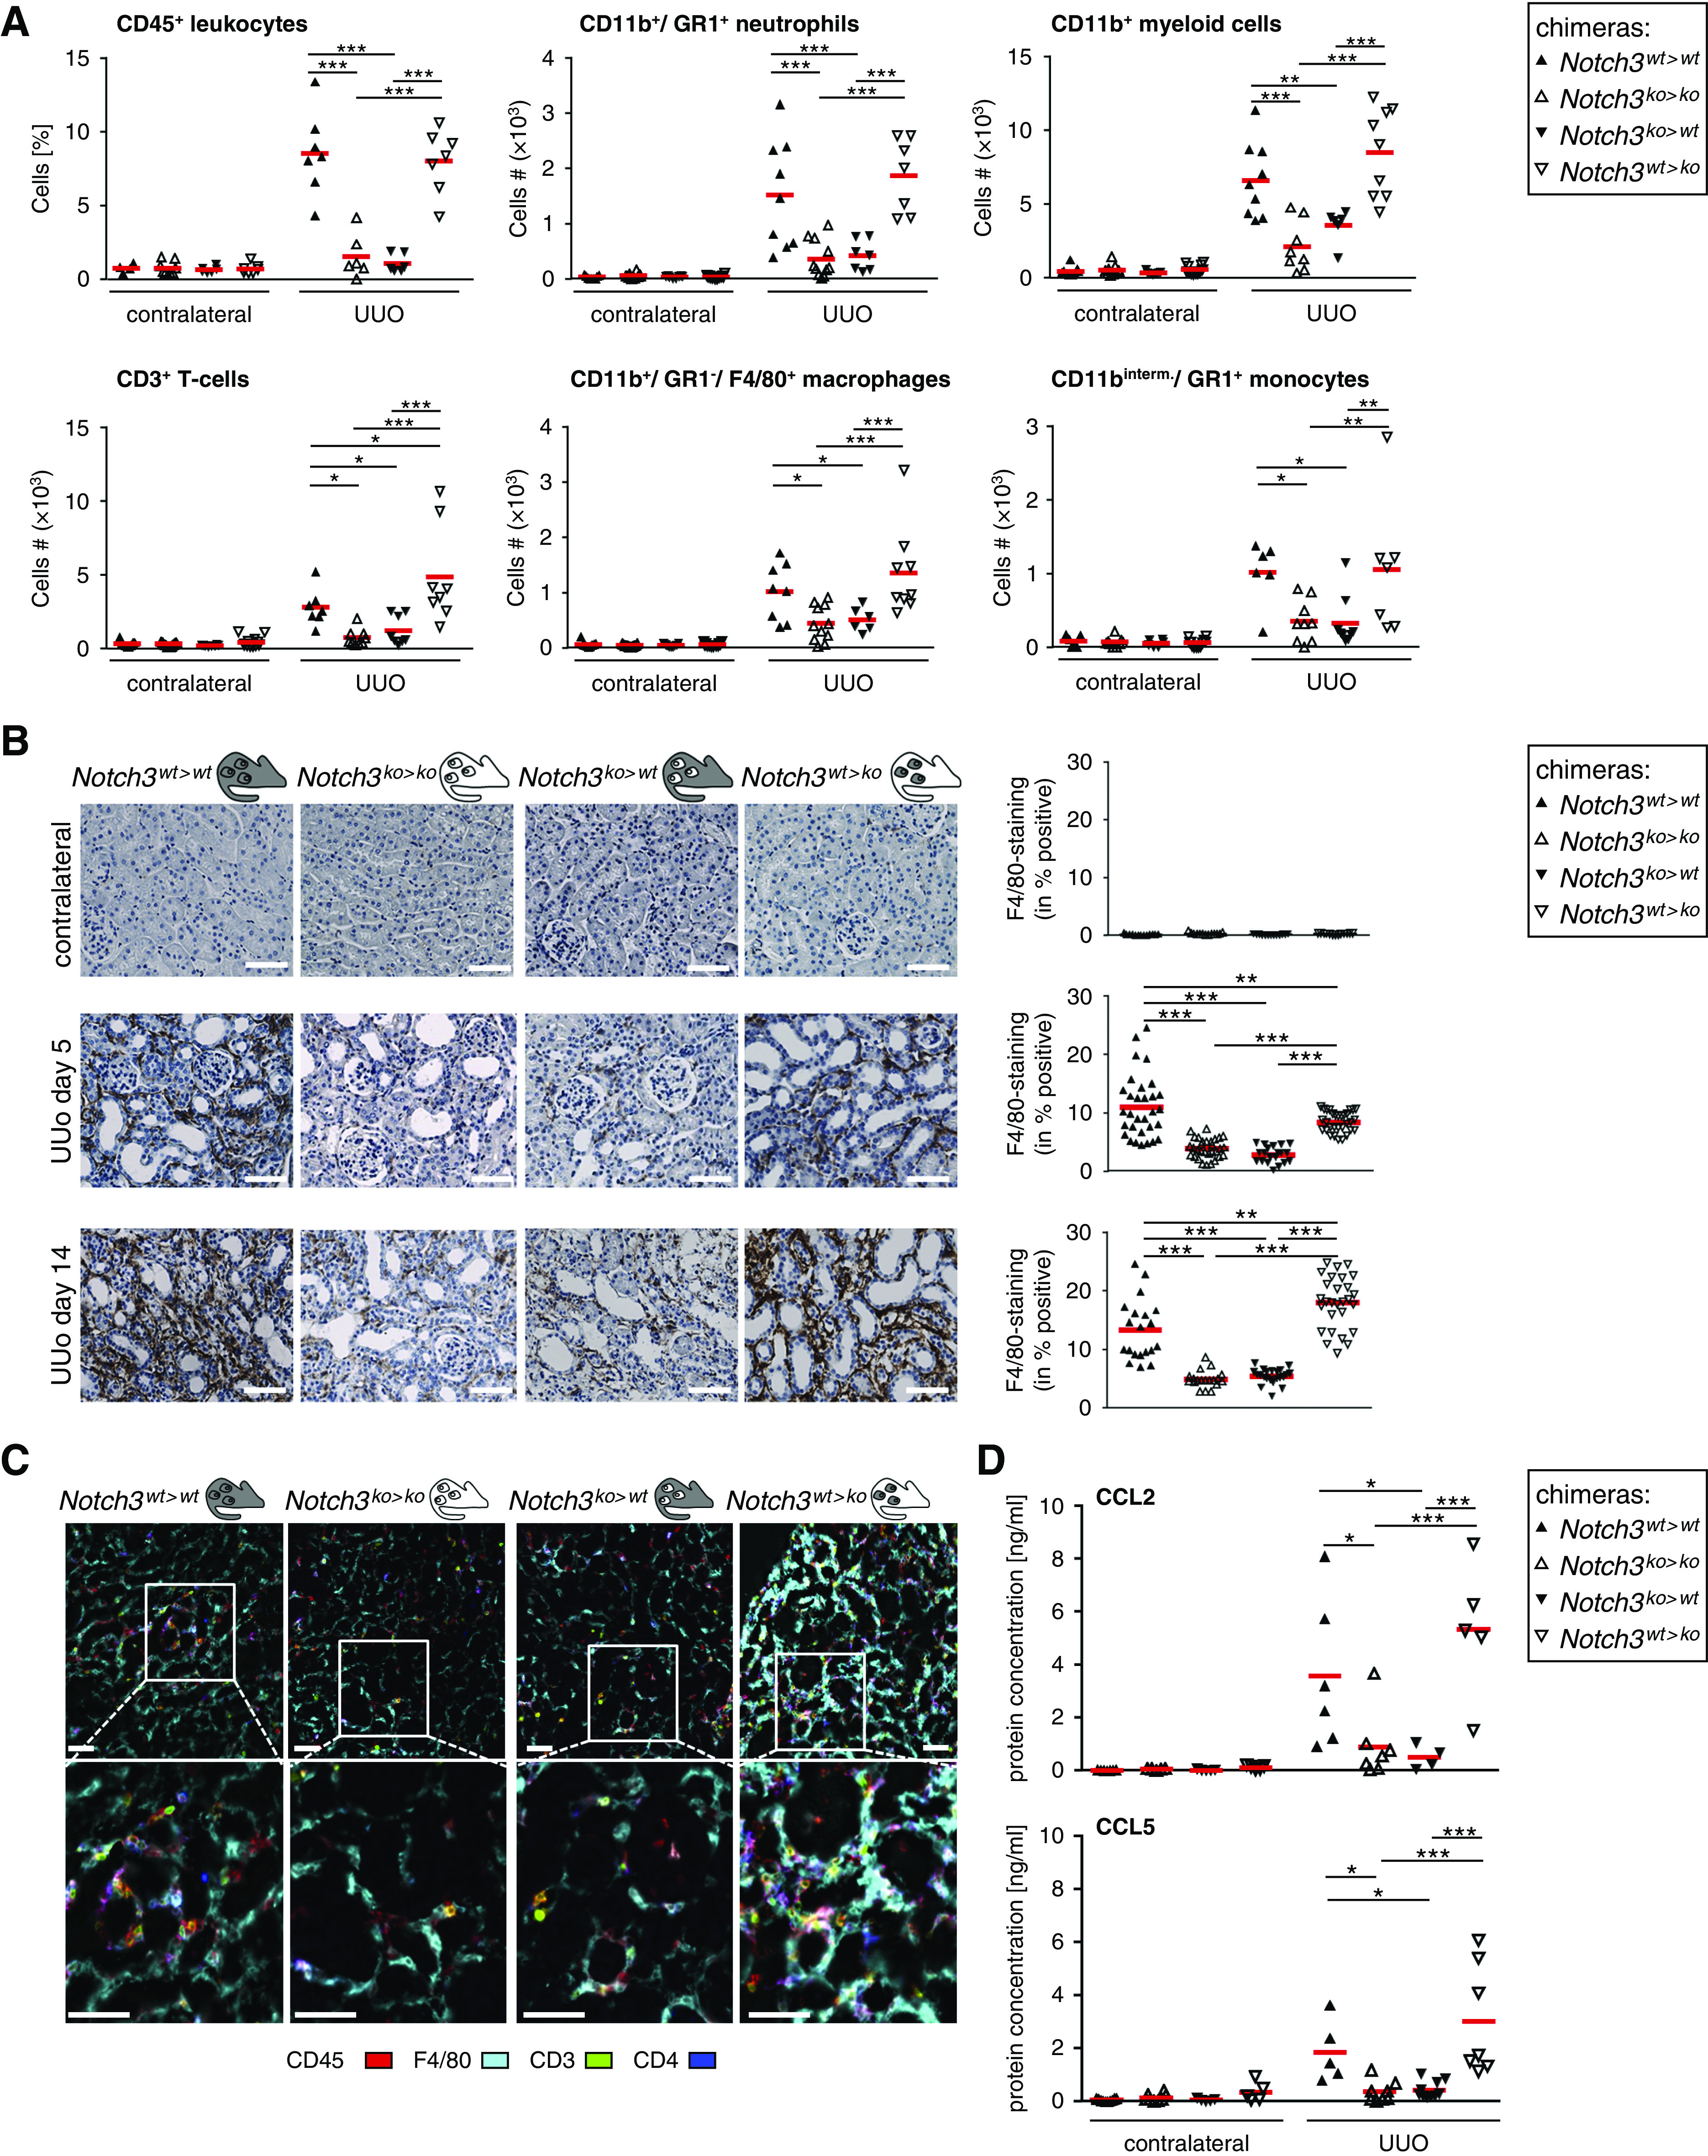
Figure 3.

Immune cell infiltration is dependent on Notch3 expression on BM-derived cells. (A) Effect of Notch3 expression on immune cell infiltration after the induction of UUO. Healthy (contralateral) and diseased kidneys of the four types of chimeric mice were harvested after UUO. Kidney tissue was digested with collagenase and the resulting single-cell suspension was stained and characterized by flow cytometry (gating strategy shown in Supplemental Figure 6). All data collection and analyses were performed using FlowJo software (Ashland, OR). Controls were used for gating analyses to distinguish immunopositive from unstained cell populations (n=12 in each group). Cell numbers were calculated from the CD45+ leukocyte population. (B) Immunostaining of infiltrating monocytes/macrophages was performed using the F4/80 antibody. Quantification was performed by assessing the positively stained cortical area. Diagrams show data obtained by computer-based morphometric analysis on days 5 and 14 after induction of UUO in obstructed and contralateral kidneys. Values indicate the relative area of tissue that stained positive. Data represent mean±SD (n=12 in each group). Scale bar, 50 μm. (C) Representative pictures of automated multidimensional fluorescence microscopy (MELC) imaging of diseased kidneys of chimeric mice. Immune cells were stained using CD45 (red), CD3 (green), CD4 (dark blue), and F4/80 (cyan). Mean fluorescence intensities were calculated as described in the Methods section. n=3. Scale bar, 50 μm. (D) Ligated or contralateral kidneys of chimeric mice were homogenized, and levels of CCL2 and CCL5 were determined after ureteral ligation using flow cytometry–based bead assays (n=6 animals per group). *P<0.05; **P<0.005; ***P<0.001.
