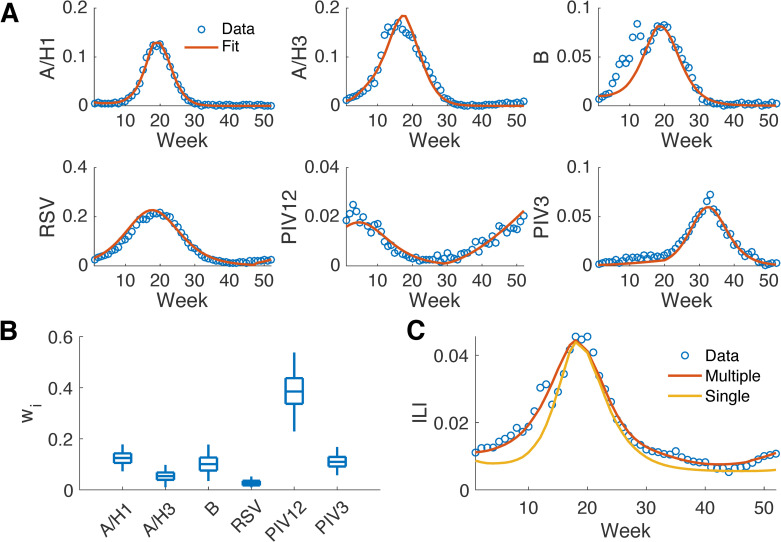
Fig 2. Disaggregation of national ILI during the 2010–2011 season to multiple viral components.
Model fitting to the positivity rates of six respiratory pathogens (A). Time starts from the 40th week in 2010. The distribution of the multiplicative factor, wi, for each pathogen obtained from MCMC (B). The boxes and whiskers show the interquartile and 95% credible intervals. Fitting ILI as an amalgamation of six pathogens versus as a single agent (C).

