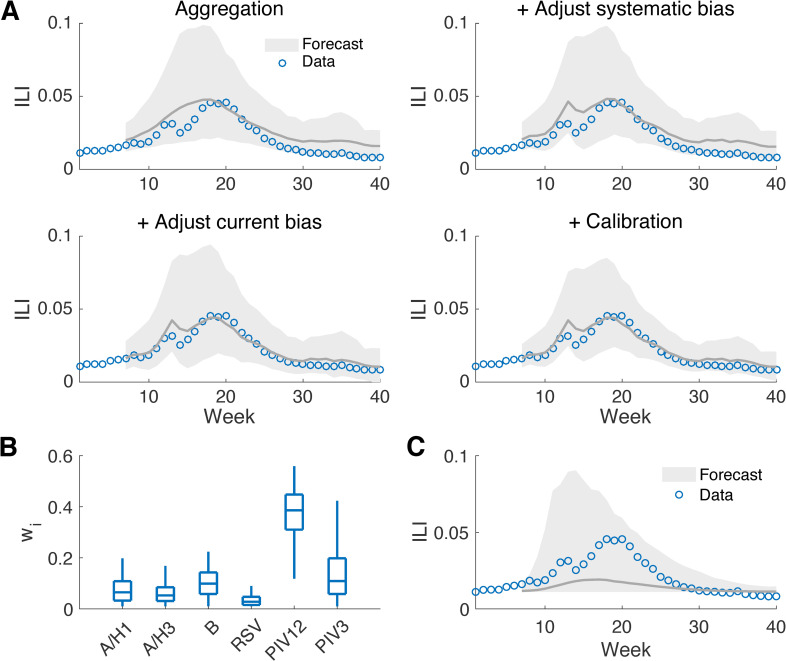
Fig 3. Forecasts generated for national ILI during the 2010–2011 season by aggregating multiple viral components.
Forecast of ILI generated by aggregating the predictions for the six viruses using MCMC-derived multiplicative factors and the effect of post-processing (A). Forecasts were generated at week 6 in the 2010–2011 season. The grey line shows the mean trajectory and the shaded area indicates the 95% prediction interval. The distributions of the inferred multiplicative factors for the six pathogens at week 6 are reported in (B). The boxes and whiskers show the interquartile and 95% credible intervals. The baseline forecast treating ILI as a single pathogen is shown in (C).

