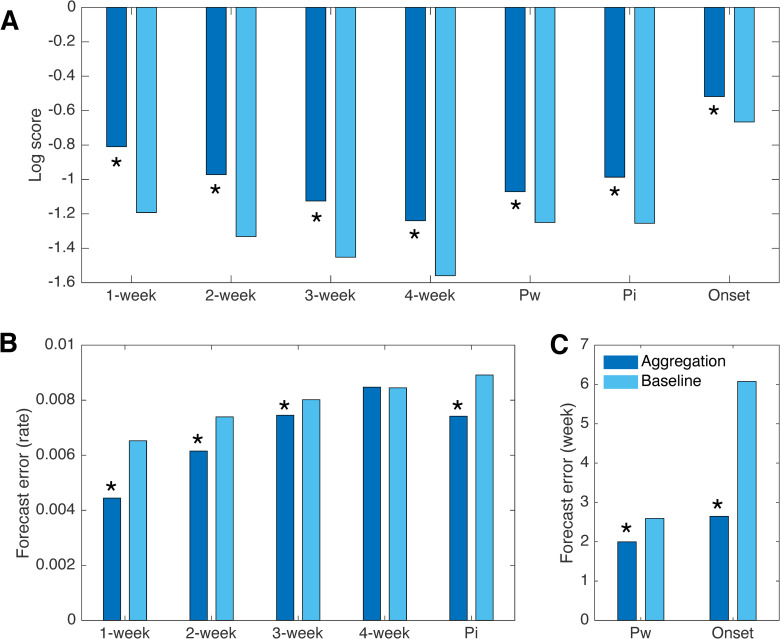
Fig 4. Comparison of forecast performance with the baseline method.
Comparisons of log scores for forecasts generated by aggregating multiple pathogens and the baseline method that simulates ILI as a single agent (A). Log scores are obtained from weekly retrospective forecasts for ILI at the national level and in HHS regions 1 to 9, from 1997–1998 to 2013–2014 seasons, excluding pandemic seasons 2008–2009 and 2009–2010. Four near-term targets (1- to 4-week ahead ILI) and three seasonal targets (peak week, peak intensity and onset week, denoted by Pw, Pi and Onset, respectively) are shown. Comparison of forecast error for predictions of 1- to 4-week ahead ILI and peak intensity (B). Comparison of forecast error for predictions of peak week and onset week (C). Asterisks indicate statistical significance for multi-pathogen forecasts outperforming baseline (p<10−5, Wilcoxon signed-rank test).

