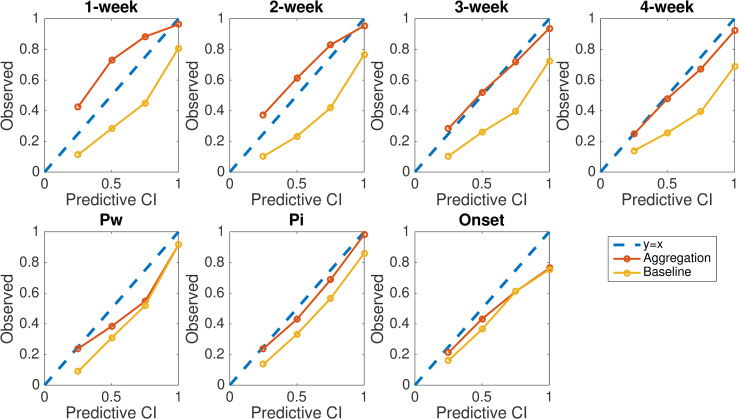
Fig 5. Reliability plots for seven targets of ILI forecast targets.
Reliability plots for 1- to 4-week ahead ILI, peak week, peak intensity, and onset week are compared for multi-pathogen and single-pathogen forecasts. Data points show the fraction of observed targets falling within the 25%, 50%, 75% and 100% prediction intervals. Results are obtained from retrospective forecasts during 15 seasons at the US national level and for HHS regions 1 to 9.

