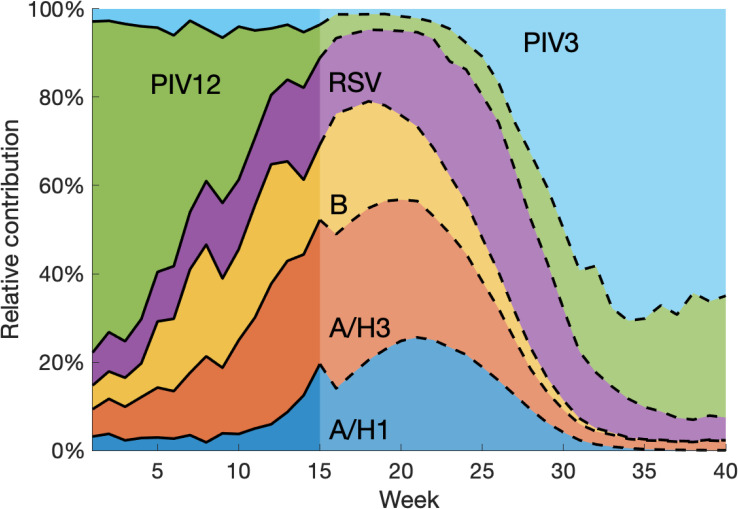
Fig 6. Forecasting the relative contribution of each pathogen to ILI.
Forecasts were generated for national data at week 15 during the 2010–2011 season. The relative contribution before week 15 was inferred using available data. After week 15, it is obtained by normalizing the weighted predicted signal of each pathogen. Note that we only considered the relative contribution among the six examined viruses. Contributions from other pathogens were not included.

