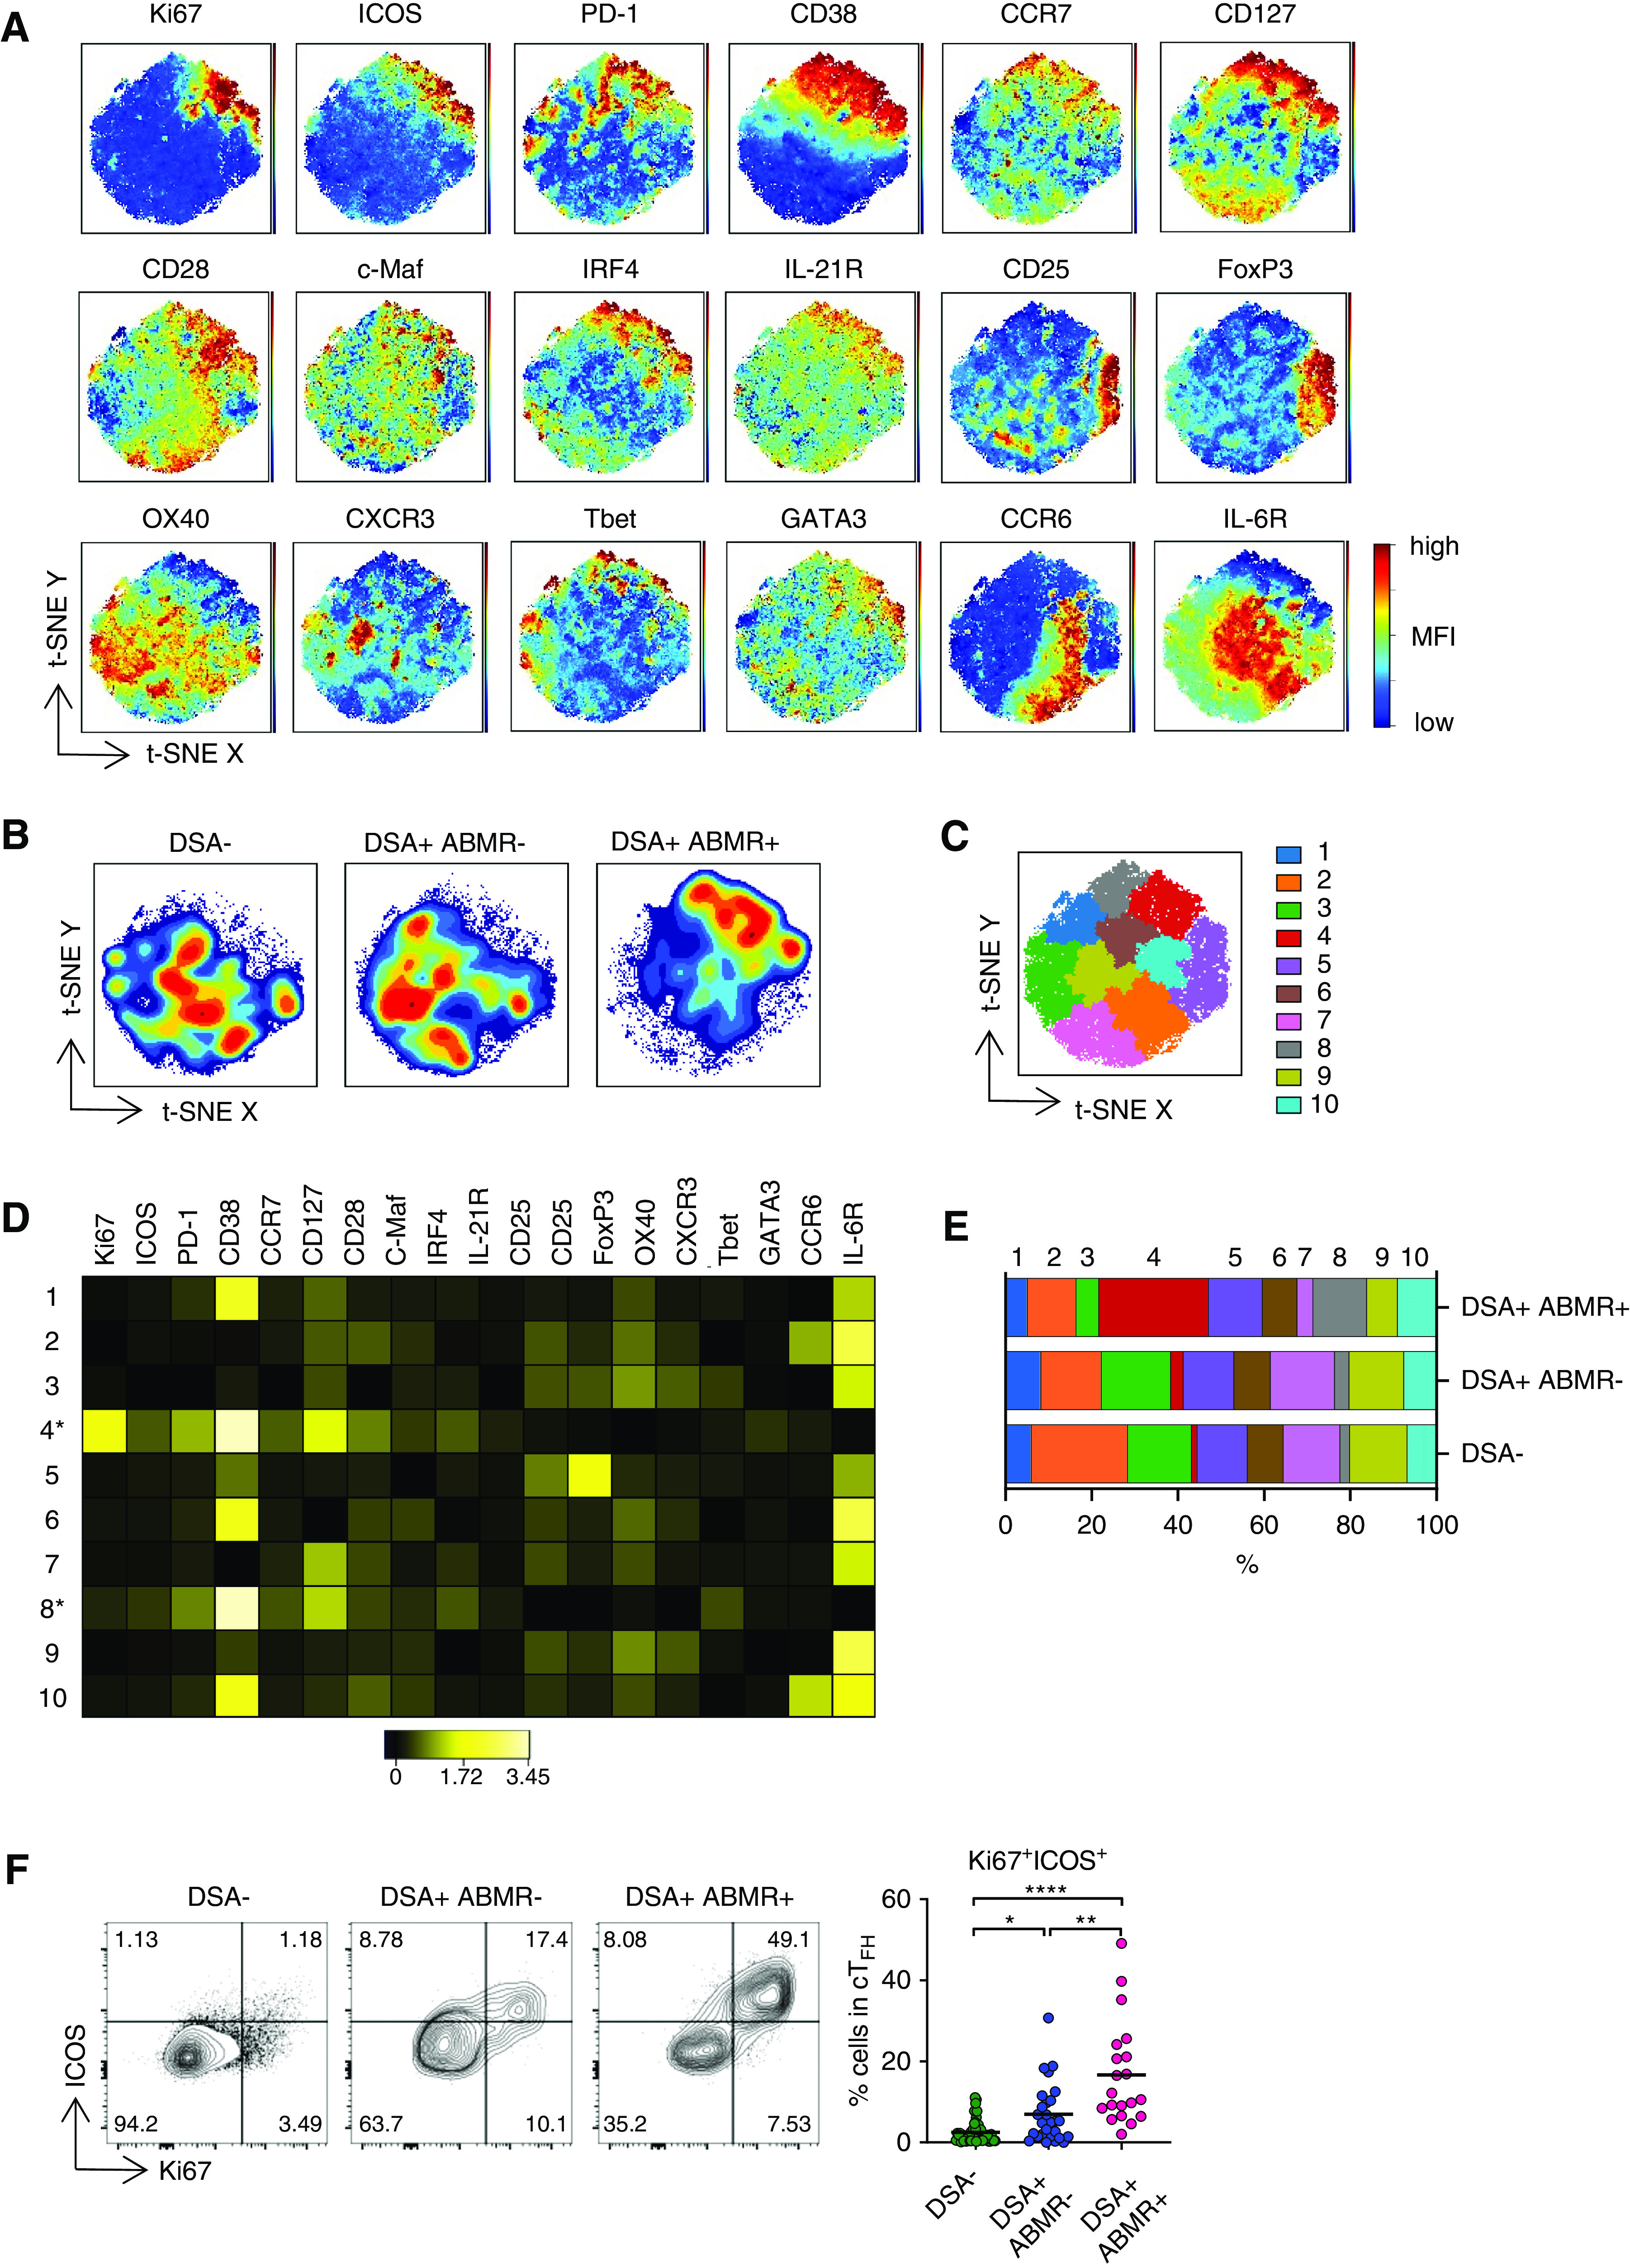
Figure 1.

cTFH associated with ABMR are heterogeneous and display activated and early memory features. (A) t-SNE projections were generated using a concatenated file of 56,100 cTFH cells from DSA− (n=20), DSA+ABMR− (n=20), and DSA+ABMR+ (n=20) patients; panels display expression levels of indicated markers (MFI). (B) t-SNE projections of cTFH cell densities in the three patient groups using 18,700 cells from each group, shown in (A). (C) t-SNE map overlaid with 10 cTFH cell clusters delineated by SPADE clustering of the concatenated file, as in (A). (D) Heatmap showing the expression of markers for each cTFH cell cluster according to transformed MFI ratio. Cell clusters 4 and 8 (*) are distinct from others. (E) Stacked bar plot showing cTFH cell cluster distribution on the basis of SPADE clustering as in (C). Clusters 2, 3, 4, 7, 8, and 9 are significantly different in their proportions across the indicated groups. (F) Representative examples of flow cytometry analysis and dot plot of percentages of Ki67+ICOS+ cells in cTFH are displayed for DSA− (n=48), DSA+ABMR− (n=27), and DSA+ABMR+ (n=20) patients. Kruskal–Wallis with Dunn post-test for panel (E and F). *P<0.05; **P<0.01; ****P<0.001. Each dot represents one patient and horizontal lines are mean values.
