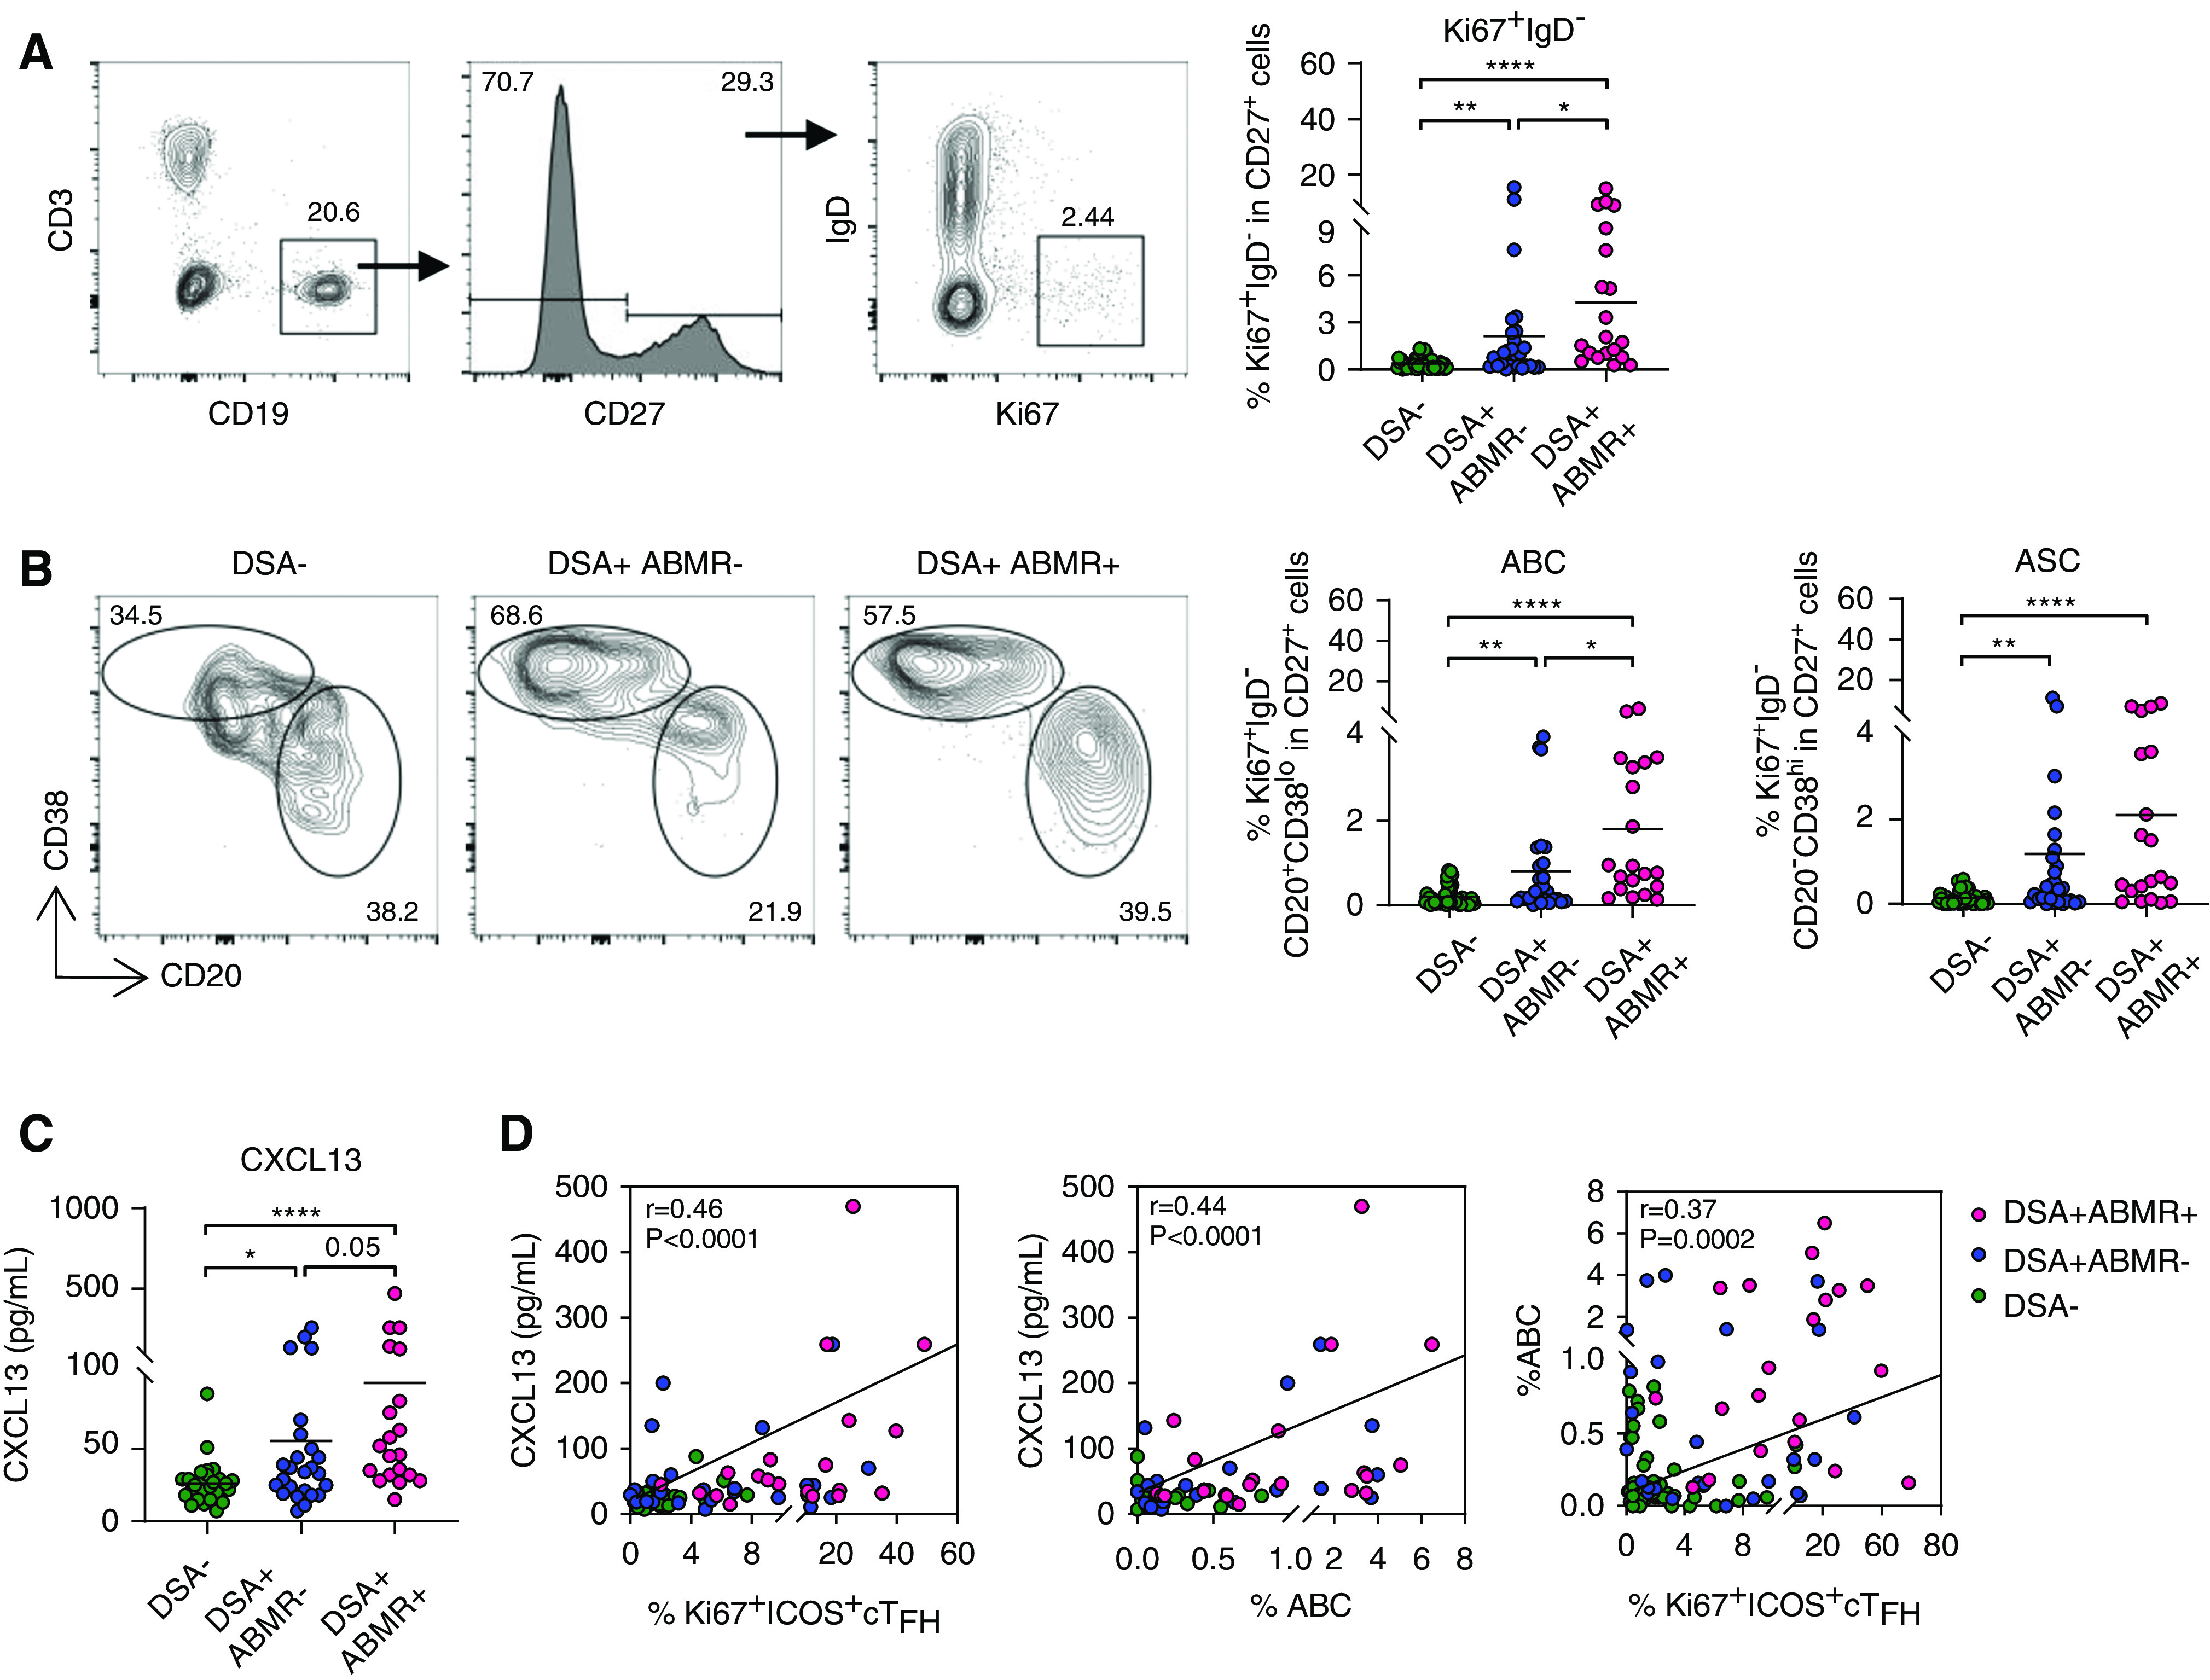
Figure 4.

Concomitant emergence of activated cTFH and B cells in blood is reflective of increased GC activity.ctivated B cells emerge concomitantly in blood and reflect active GC responses. Flow cytometry analysis of blood B cells in patients analyzed for cTFH in Figure 1F. (A) Representative examples of flow cytometry analysis and dot plots of percentages of Ki67+IgD− among CD27+ cells are displayed for DSA− (n=48), DSA+ABMR− (n=27) and DSA+ABMR+ (n=20) groups. (B) Representative flow cytometry analysis and percentages of Ki67+IgD−CD20+CD38lo ABCs and Ki67+IgD−CD20−CD38hi ASCs among CD27+ cells are displayed for DSA− (n=48), DSA+ABMR− (n=27) and DSA+ABMR+ (n=20) groups. (C) Plasma CXCL13 levels measured by ELISA for DSA− (n=28), DSA+ABMR− (n=25), and DSA+ABMR+ (n=20) groups. (D) Spearman correlation analysis of Ki67+ICOS+ cTFH and ABCs with plasma CXCL13 levels for DSA− (n=28), DSA+ABMR− (n=25), and DSA+ABMR+ (n=20) groups. Mann-Whitney U test was used for (A–C). *P<0.05; **P<0.01; ****P<0.001. Each dot represents one patient.
