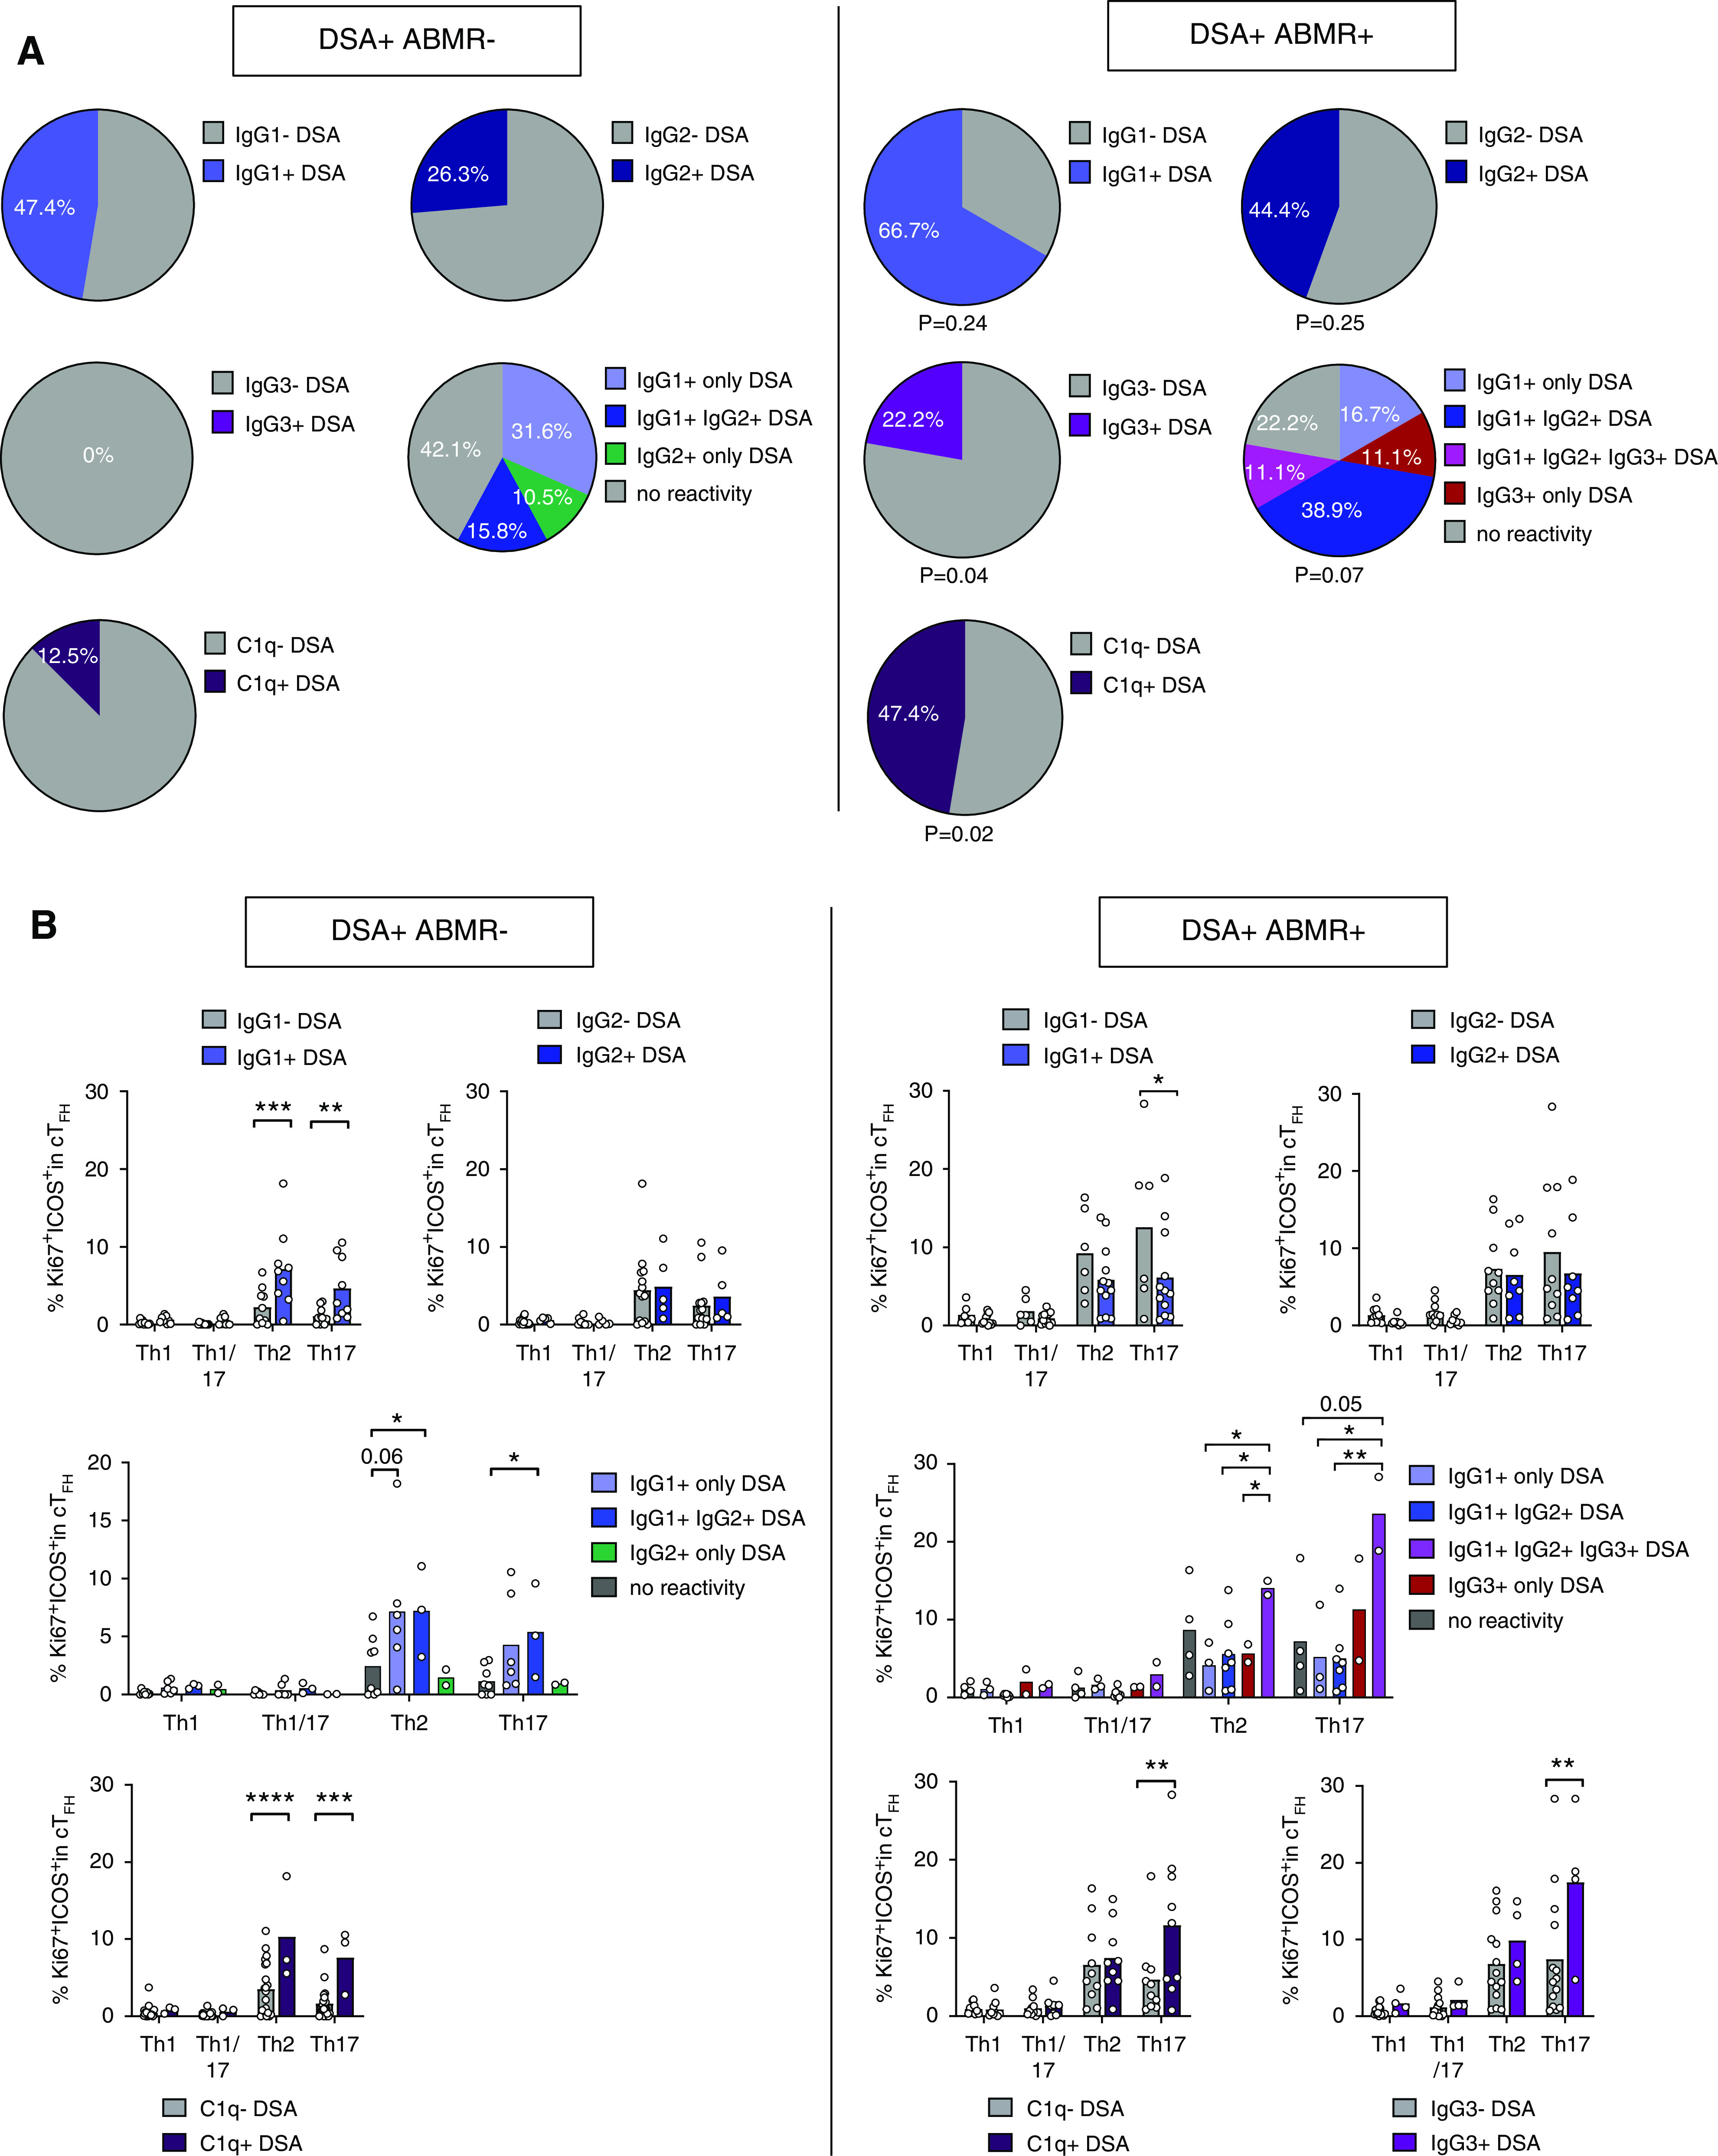
Figure 5.

Altered cTFH polarization correlates with differential DSA pathogenicities. (A) Proportions of patients that were positive for the indicated DSA IgG isotypes in the two patient groups are displayed for DSA+ABMR− (n=19, left panel) and DSA+ABMR+ (n=18, right panel). C1q-binding analysis was performed using DSA+ABMR− (n=24, left panel) and DSA+ABMR+ (n=19, right panel) patient serum samples. P values of chi-squared test for the comparison between patient groups are shown. (B) Flow cytometry analysis of percentages of Ki67+ICOS+ Th1, Th1/17, Th2, and Th17 cells among cTFH from DSA+ABMR− and DSA+ABMR+ patients are shown. Sample size as in (A). Kruskal–Wallis test with Dunn post-test. *P<0.05; **P<0.01; ****P<0.001. Each dot represents one patient and horizontal lines are mean values.
