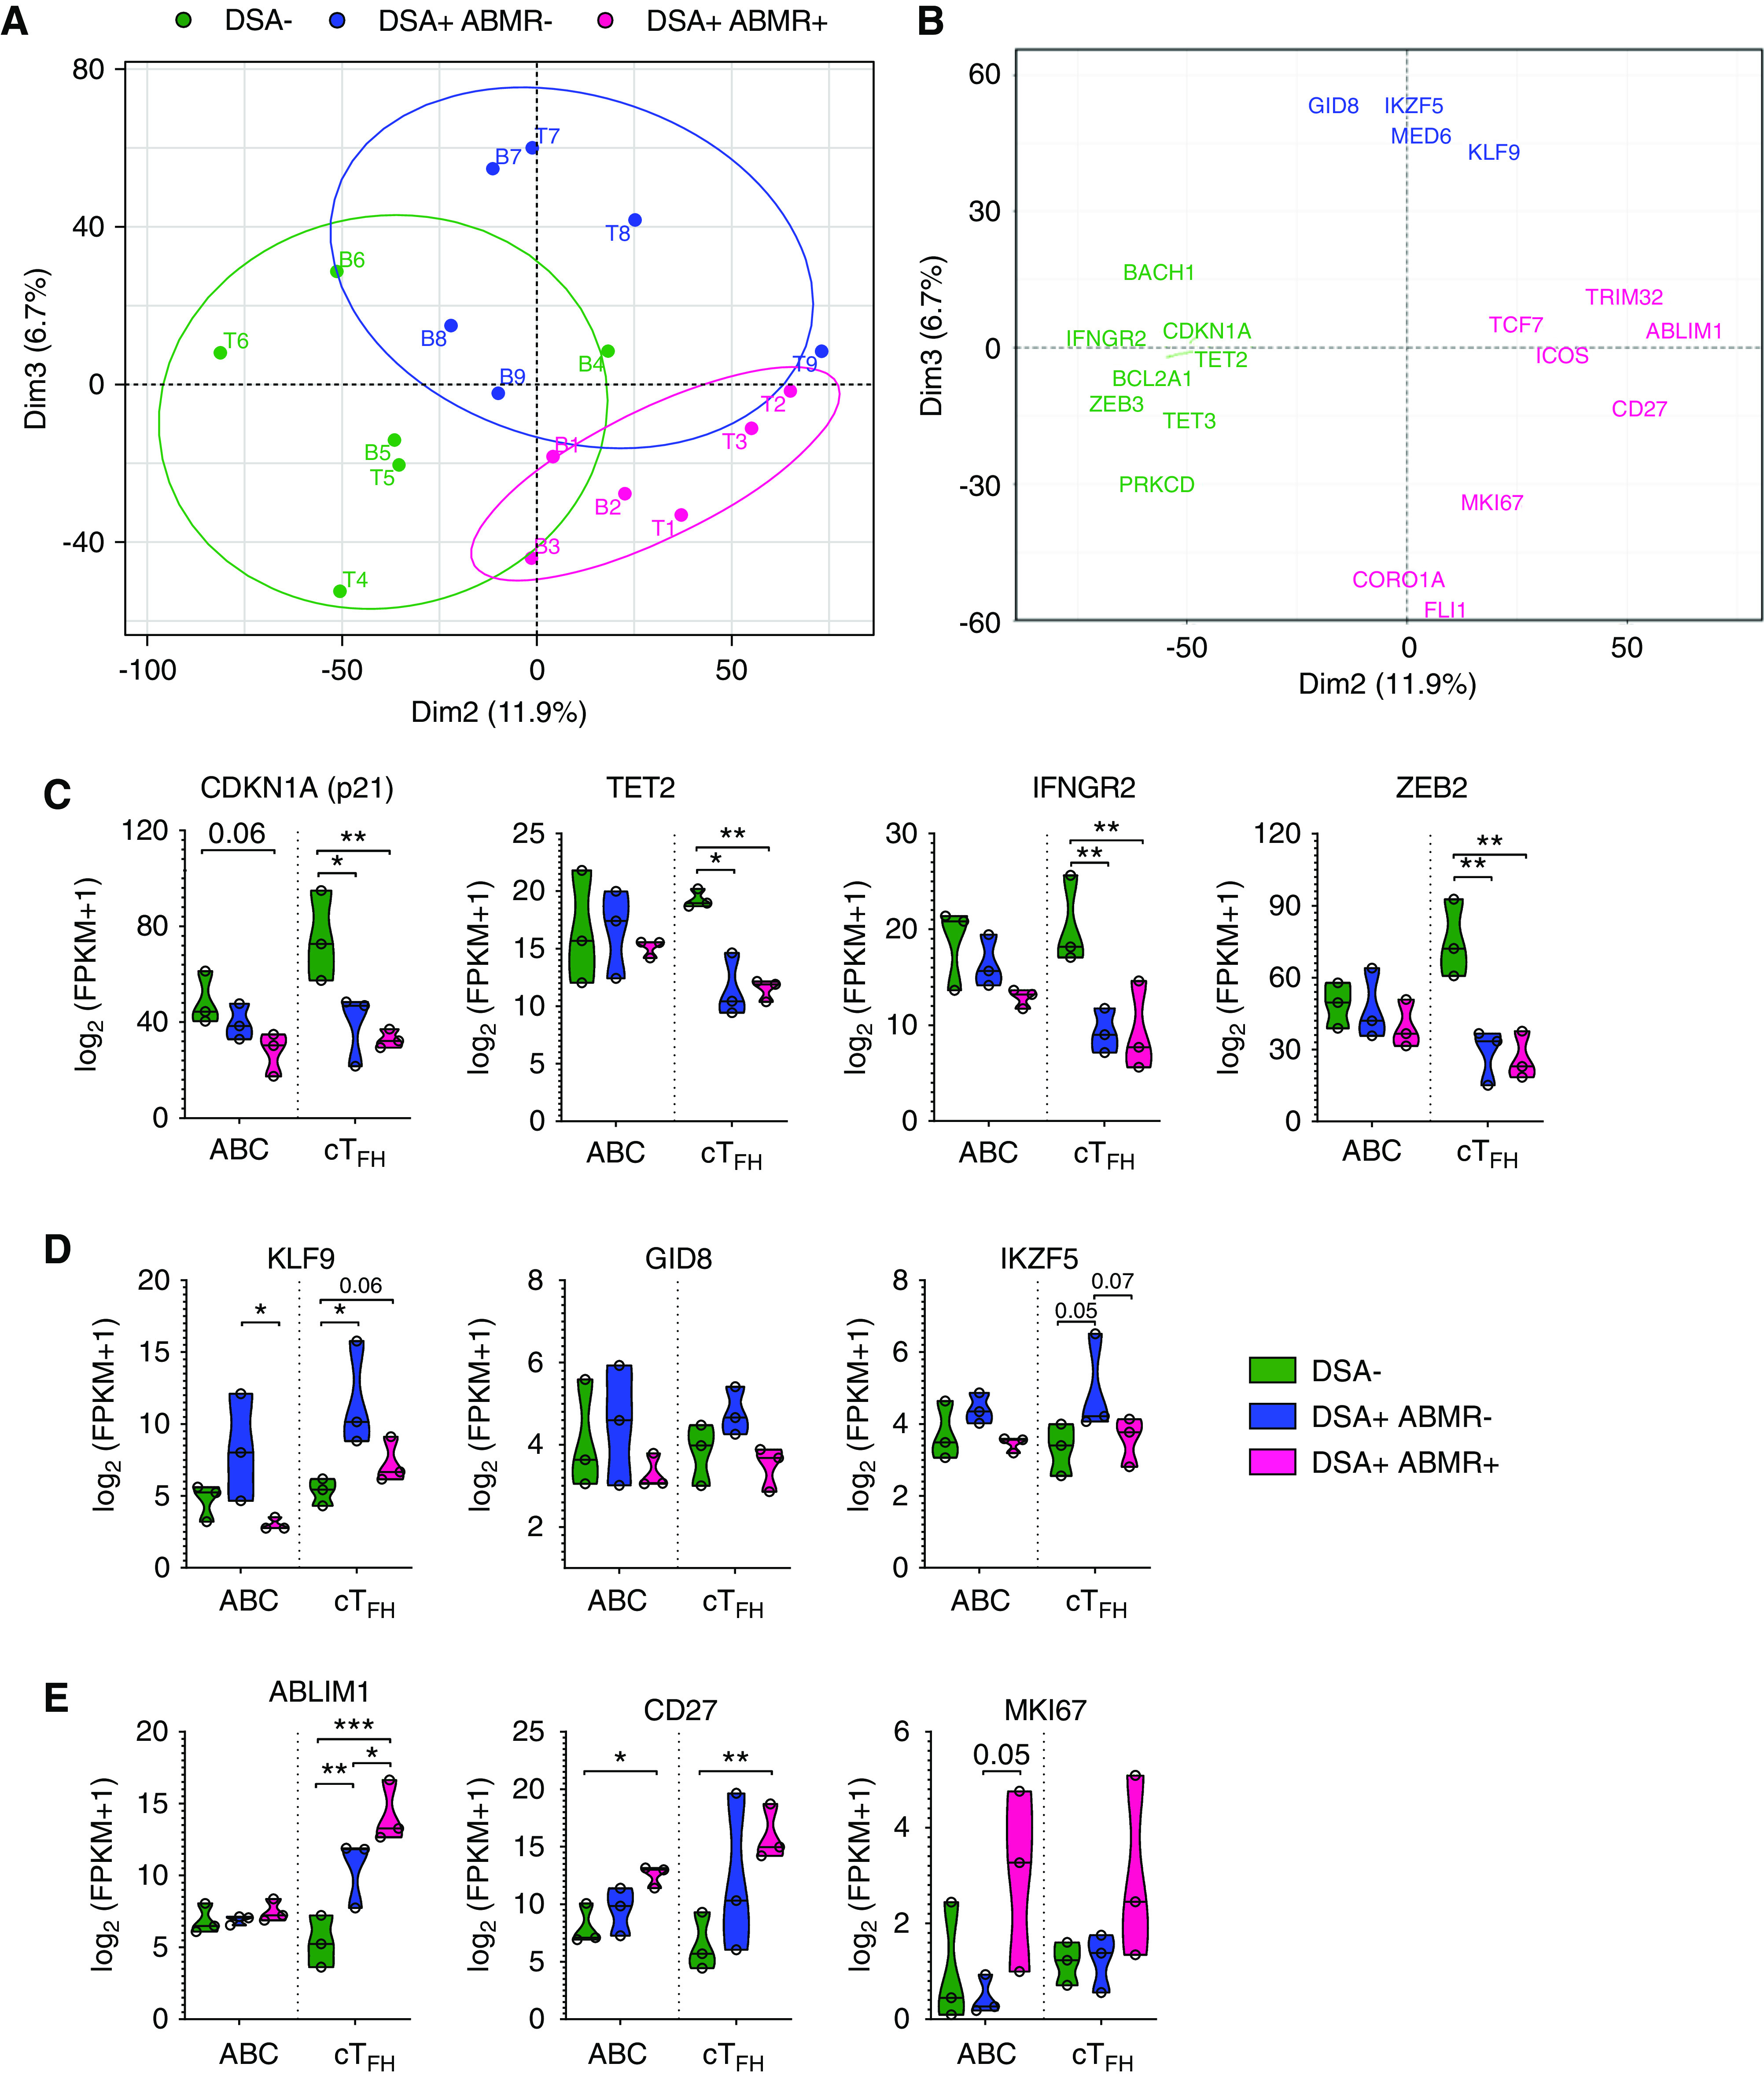
Figure 6.

Coordinated transcriptional programs in cTFH and ABCs of patients with ABMR. (A) PCA of the cTFH and ABC RNA-sequencing patterns for each patient group (n=3 patients per group) are depicted. PC2 and PC3 delineate the cTFH (T1–9) and ABCs (B1–9) from DSA− (green), DSA+ABMR− (blue), and DSA+ABMR+ (pink) patients as separate clusters. (B) Genes that drive PC2 and PC3 (selected from the top 60 genes contributing to each PC, along with biologically relevant others) are displayed. (C–E) Violin plots of expression levels of indicated genes that covary in cTFH and ABCs in the three patient groups. Multiple t test with Holm–Sidak correction for (C–E). *P<0.05; **P<0.01; ***P<0.001. Each dot represents one patient.
