Figure 7.

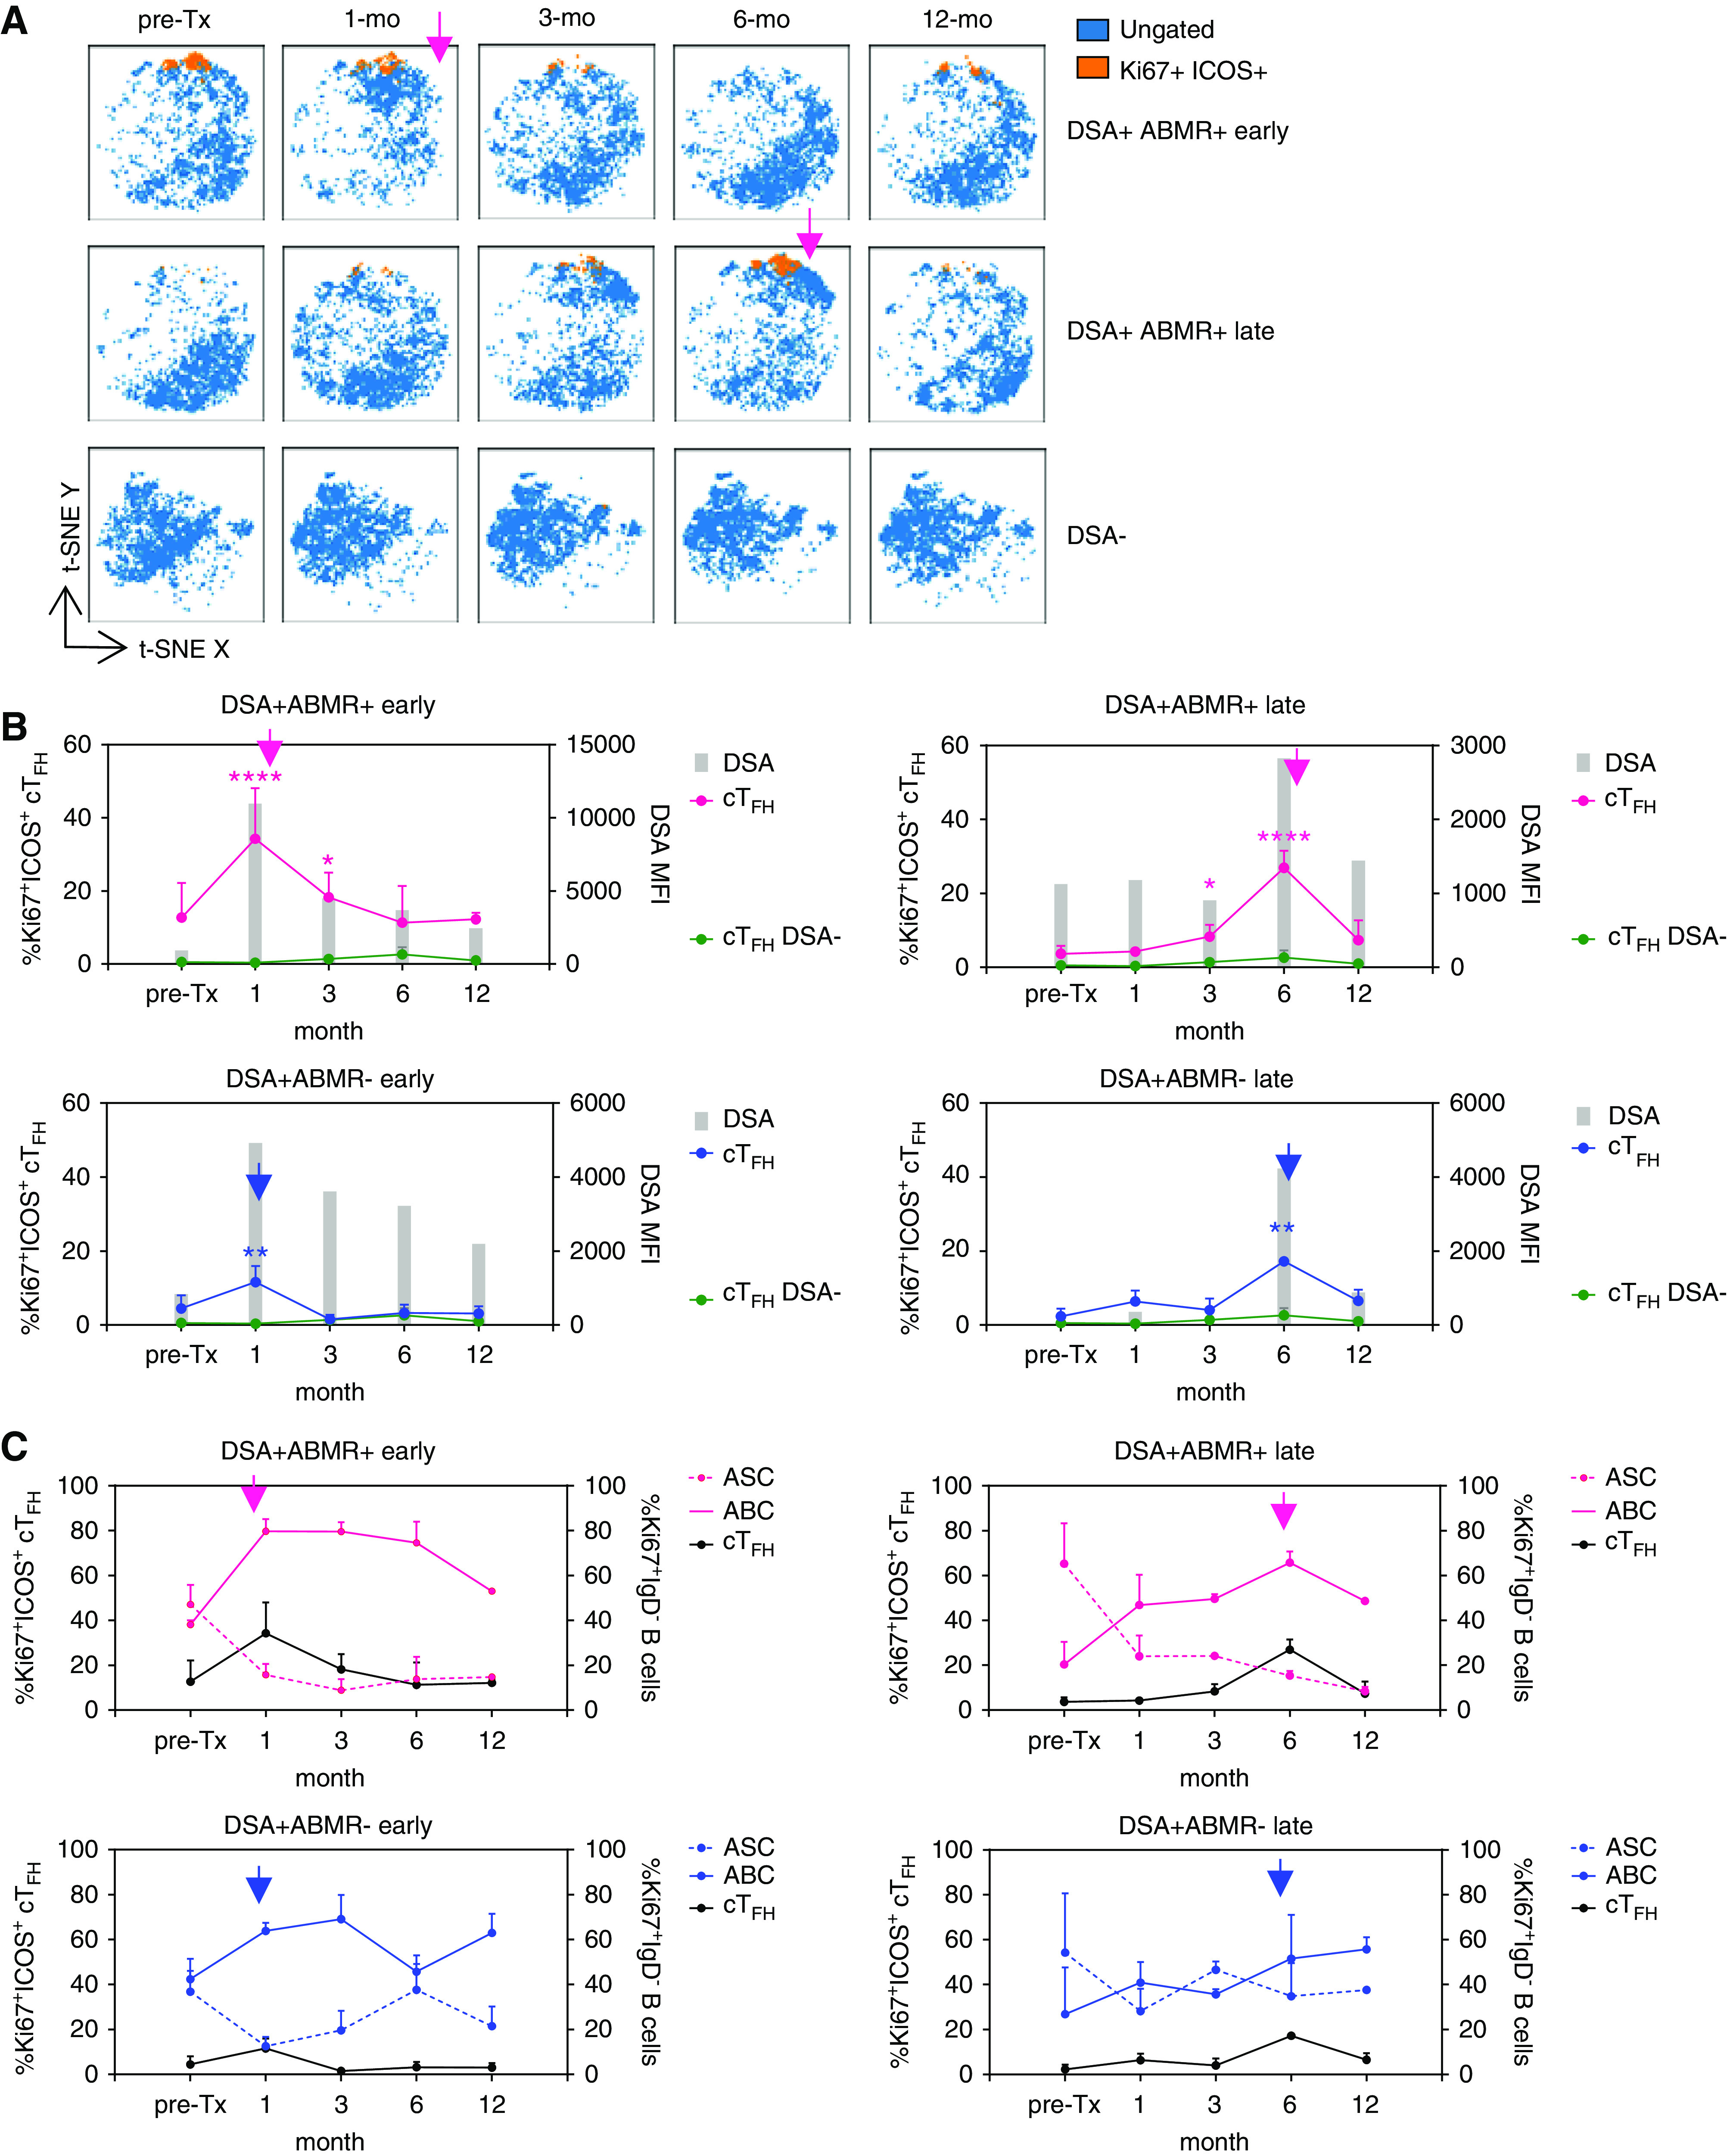
Dynamics of cTFH and ABC responses correlate with timing of ABMR onset. Patients were sampled longitudinally from pretransplant to the indicated intervals. (A) t-SNE projections of cTFH cells from three individual patients, overlaid with those that are Ki67+ICOS+. Each t-SNE map is on the basis of n=3000 cells per time point. Pink arrows indicate the time point of onset of ABMR. (B) Kinetics of emergence of Ki67+ICOS+ cTFH (connecting lines) and DSAs (gray bars) in indicated patient groups: DSA− (n=5), DSA+ABMR− early (n=5), DSA+ABMR− late (n=2), DSA+ABMR+ early (n=2), and DSA+ABMR+ late (n=2). Mixed-effects model for comparison of %Ki67+ICOS+ cTFH between DSA+ABMR+ or DSA+ABMR− groups with the DSA− group. *P<0.05; **P<0.01; ****P<0.001. (C) Kinetics of cTFH, ABCs, and ASCs in patient groups, as in (B). Blue arrows indicate the time of DSA emergence post-transplant and pink arrows indicate the time point of ABMR onset. cTFH, ABC, and ASC data are shown as percentage±SEM and DSA bars represent mean values.
