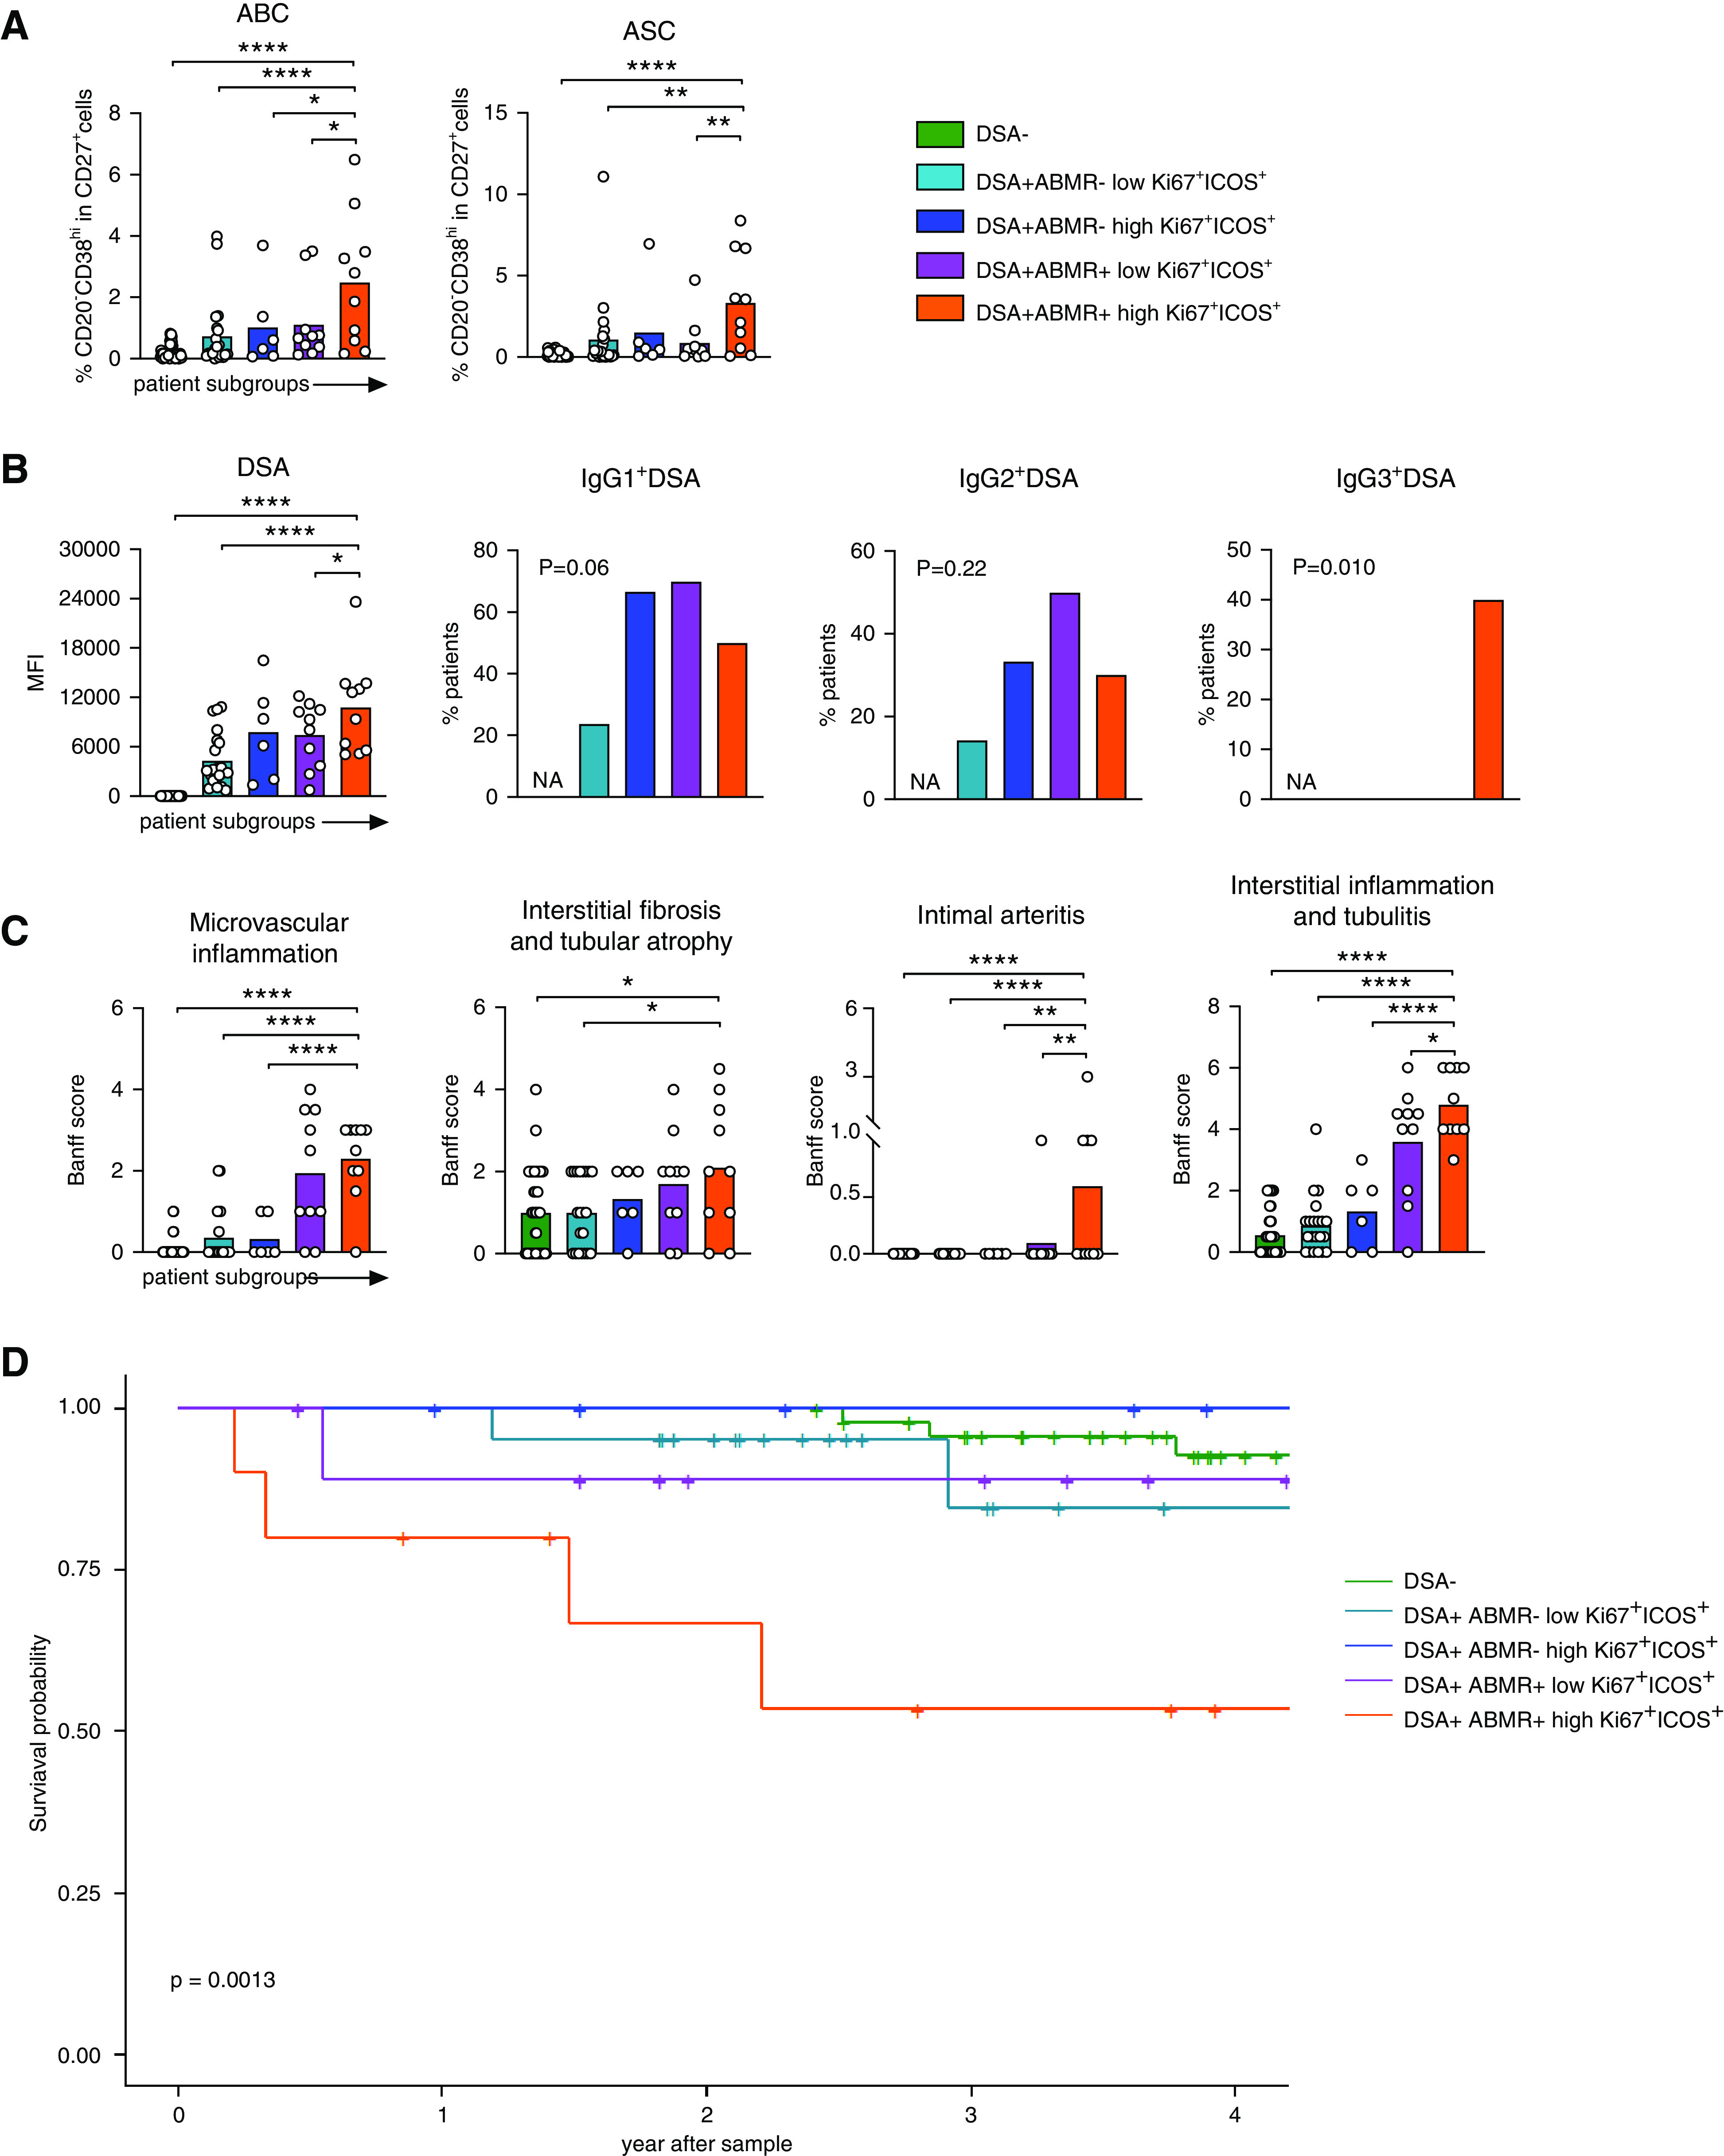
Figure 8.

High frequencies of activated cTFH are associated with increased B cell and DSA responses, more allograft injury, and decreased allograft survival. DSA+ABMR− and DSA+ABMR+ patients were stratified into subgroups on the basis of the median percentage of Ki67+ICOS+ cTFH <11.4% (low) and >11.4% (high) in the DSA+ABMR+ group, as shown in Figure 1F. Data shown from indicated patient subgroups: DSA+ABMR− low (n=21), DSA+ABMR− high (n=6), DSA+ABMR+ low (n=10), DSA+ABMR+ high (n=10), and DSA− (n=48) are displayed. (A and B) Dot plots of percentages of ABCs and ASCs by flow cytometry, levels of DSAs, and proportions of patients that were positive for IgG1, IgG2, and IgG3 DSA by Luminex analysis, evaluated at the time of flow cytometry analysis of the cTFH, are displayed for DSA+ABMR− low (n=21), DSA+ABMR− high (n=6), DSA+ABMR+ low (n=10), DSA+ABMR+ high (n=10), and DSA− (n=48) patients. (C) Histologic Banff scores of kidney allograft lesions evaluated at the time of flow cytometry analysis of the cTFH. Microvascular inflammation indicated by glomerulitis+peritubular capillaritis Banff score and interstitial fibrosis and tubular atrophy indicated by IF/TA Banff score. One-way ANOVA with Dunnett post-test for (A–C). *P<0.05; **P<0.01; ****P<0.001. Each dot represents one patient and horizontal lines of bars are mean values. (D) Kaplan–Meier of allograft survival rate in each subgroup of patients; sample size as in (A). Log-rank test.
