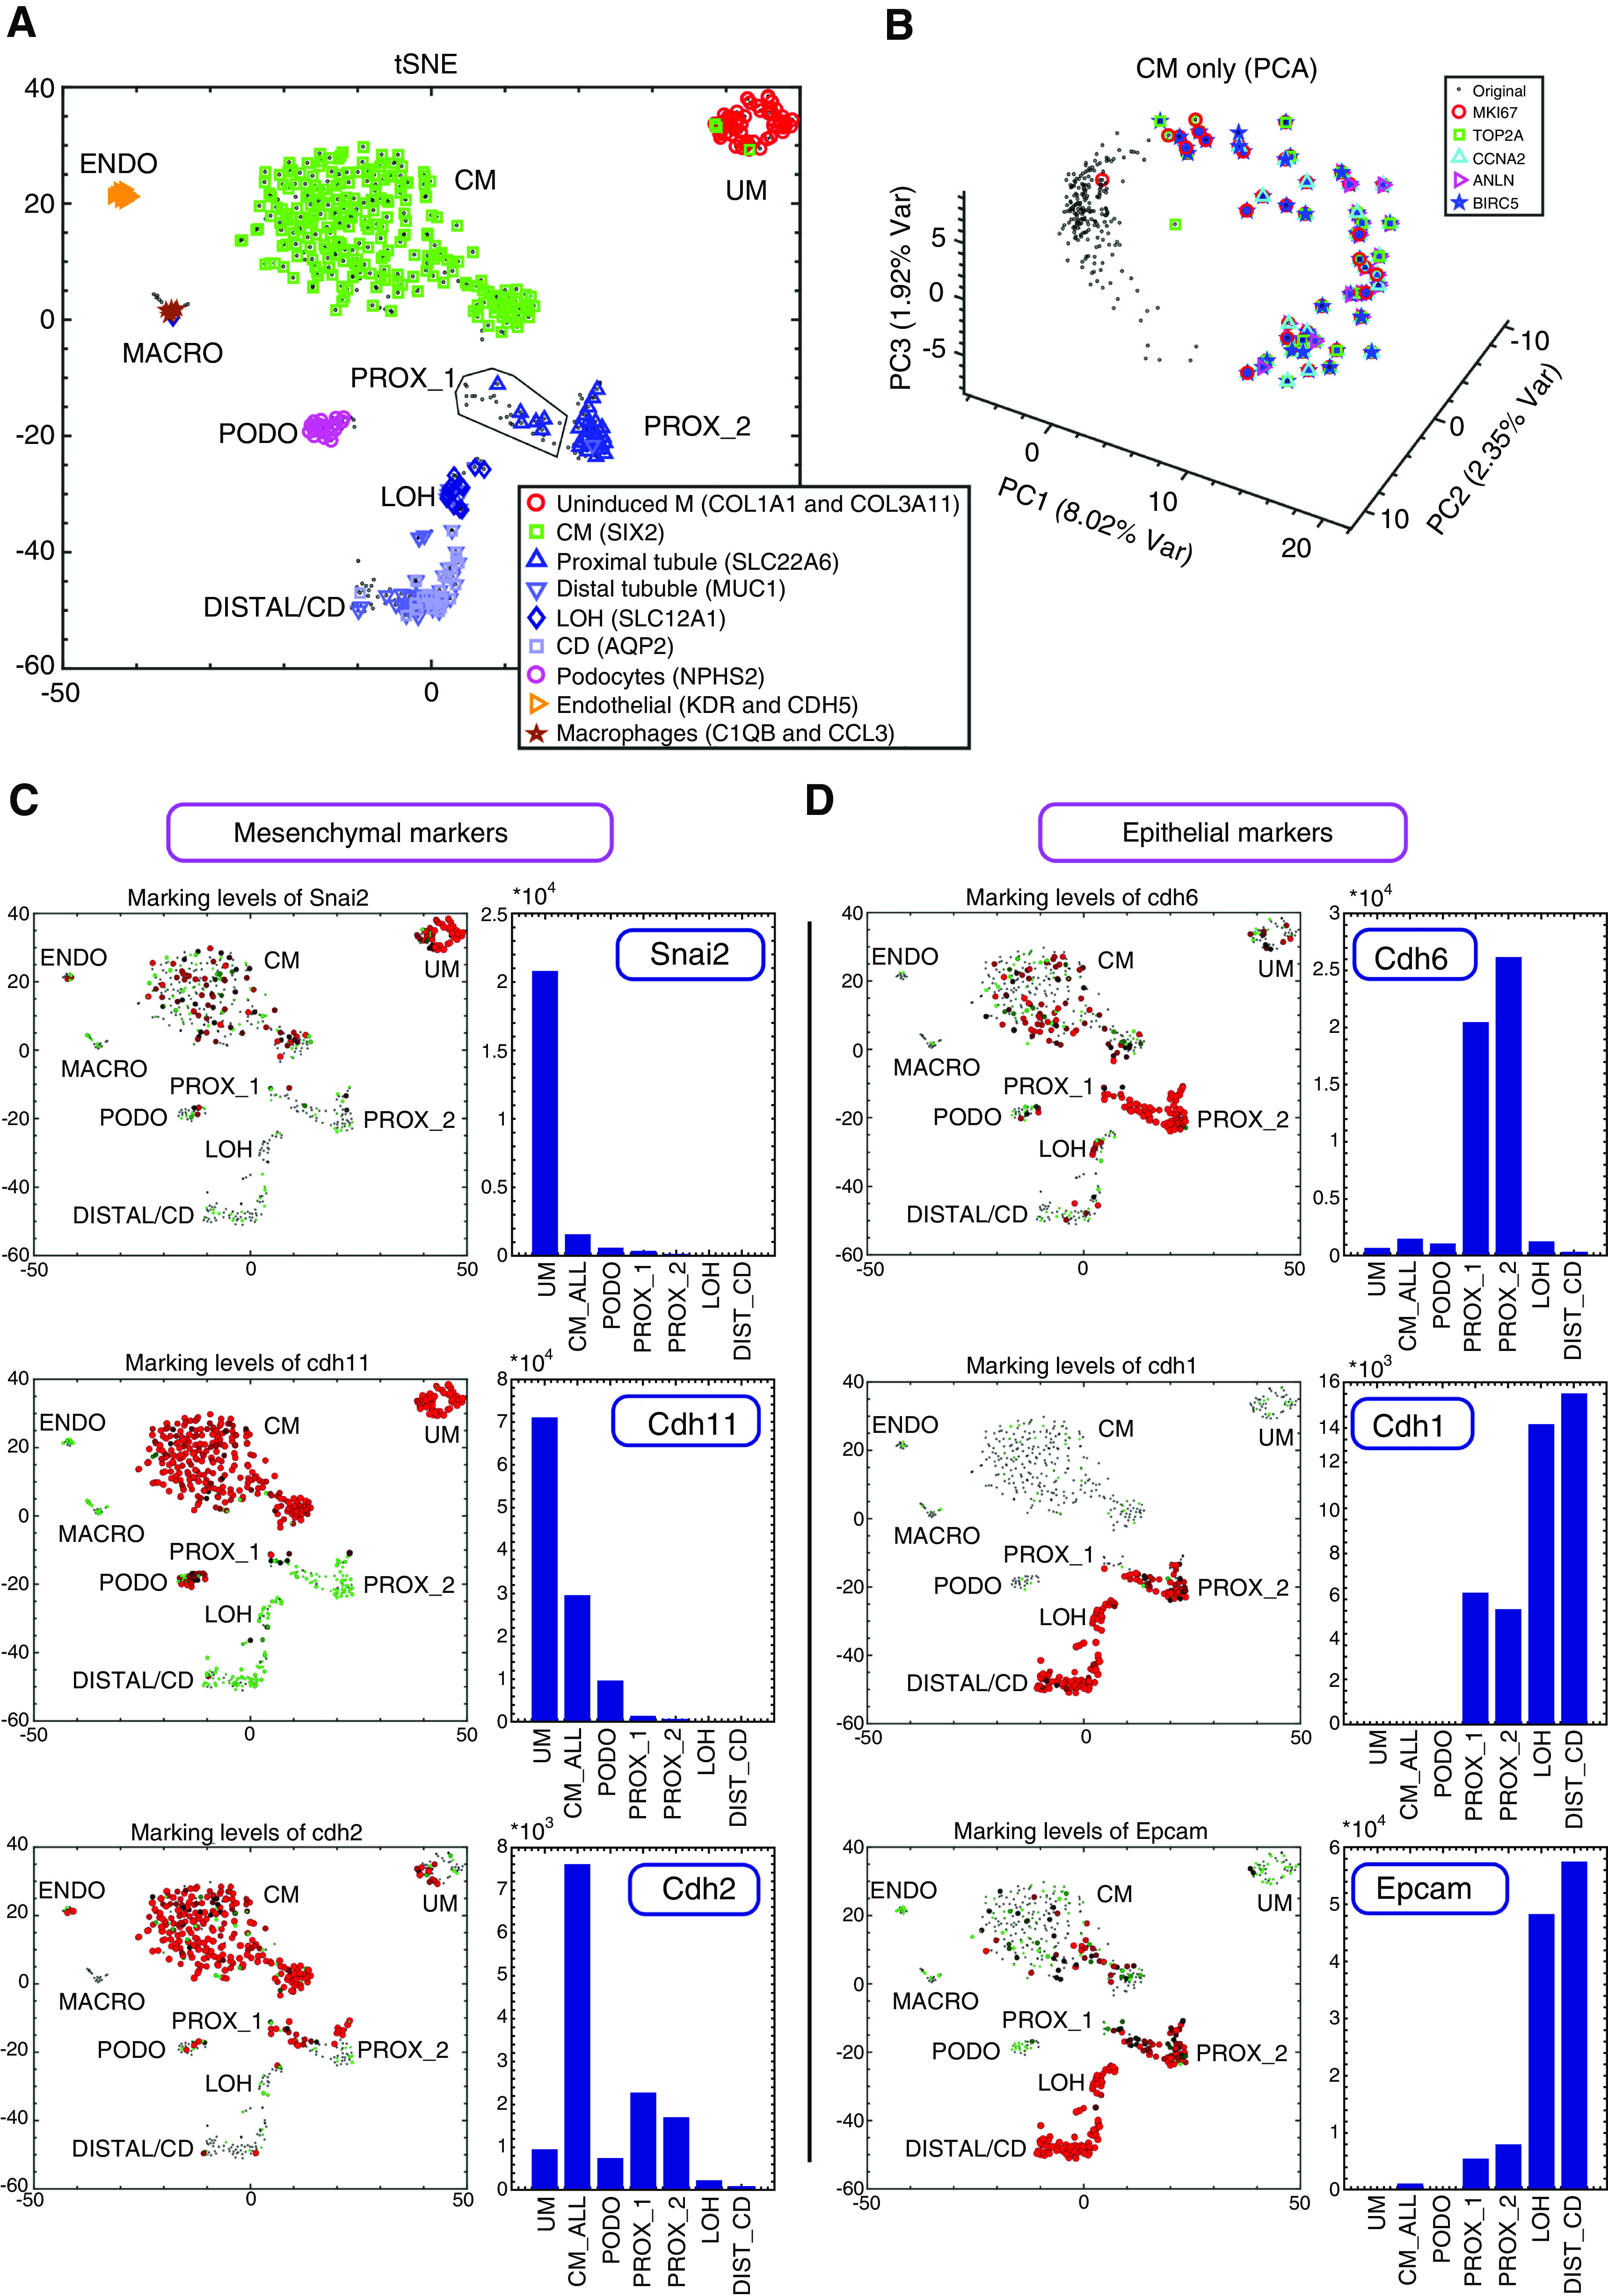
Figure 2.

Single-cell gene expression analysis enables characterization of cellular heterogeneity, cell cycle dynamics, and the Mesenchymal to Epithelial Transition (MET) in the developing mouse fetal kidney. (A) Shown is a tSNE plot of 544 single-cell gene expression profiles, each consisting of 728 highly variable genes (see Methods). Each cell is represented by a dot. Cells overexpressing genes that were previously shown to mark different cell types are marked by additional symbols. (B) Cells of the CM create a circular manifold in gene expression space that corresponds to the cell cycle. Shown is a PCA figure of cells from the CM only. Each cell is represented by a dot. Cells overexpressing genes such as Top2a and Mki67 (genes that were shown to be overexpressed in the S-G2-M phases of the cell cycle) are marked by additional symbols. These cells are located in a specific segment of the circular manifold representing the S-G2-M segment of the cell cycle. (C and D) Expression levels of the mesenchyme related genes Snai2, Cdh11, and Cdh2 are typically higher in the UM and CM, whereas the epithelial genes Cdh6, Cdh1, and Epcam are typically higher in the PROX_1, PROX_2, LOH, and DIST_CD. Shown are tSNE plots and bar plots showing the expression levels of selected genes. The area of each circle in each tSNE plot is proportional to log2(1+expression) of the specific gene in that particular cell. The expression level in each cell is also encoded by the circle color (red, high expression; green, low expression). The bar plots show gene expression levels in bulk in silico cell transcriptomes representing the different populations (UM, CM, PODO, PROX_1, PROX_2, LOH, and DIST_CD) that were created by uniting raw reads from all cells belonging to each population. The annotations “CM_ALL” and “CM” are used interchangeably to represent all cells that were classified as belonging to the CM (see also Supplemental Appendix 1).
