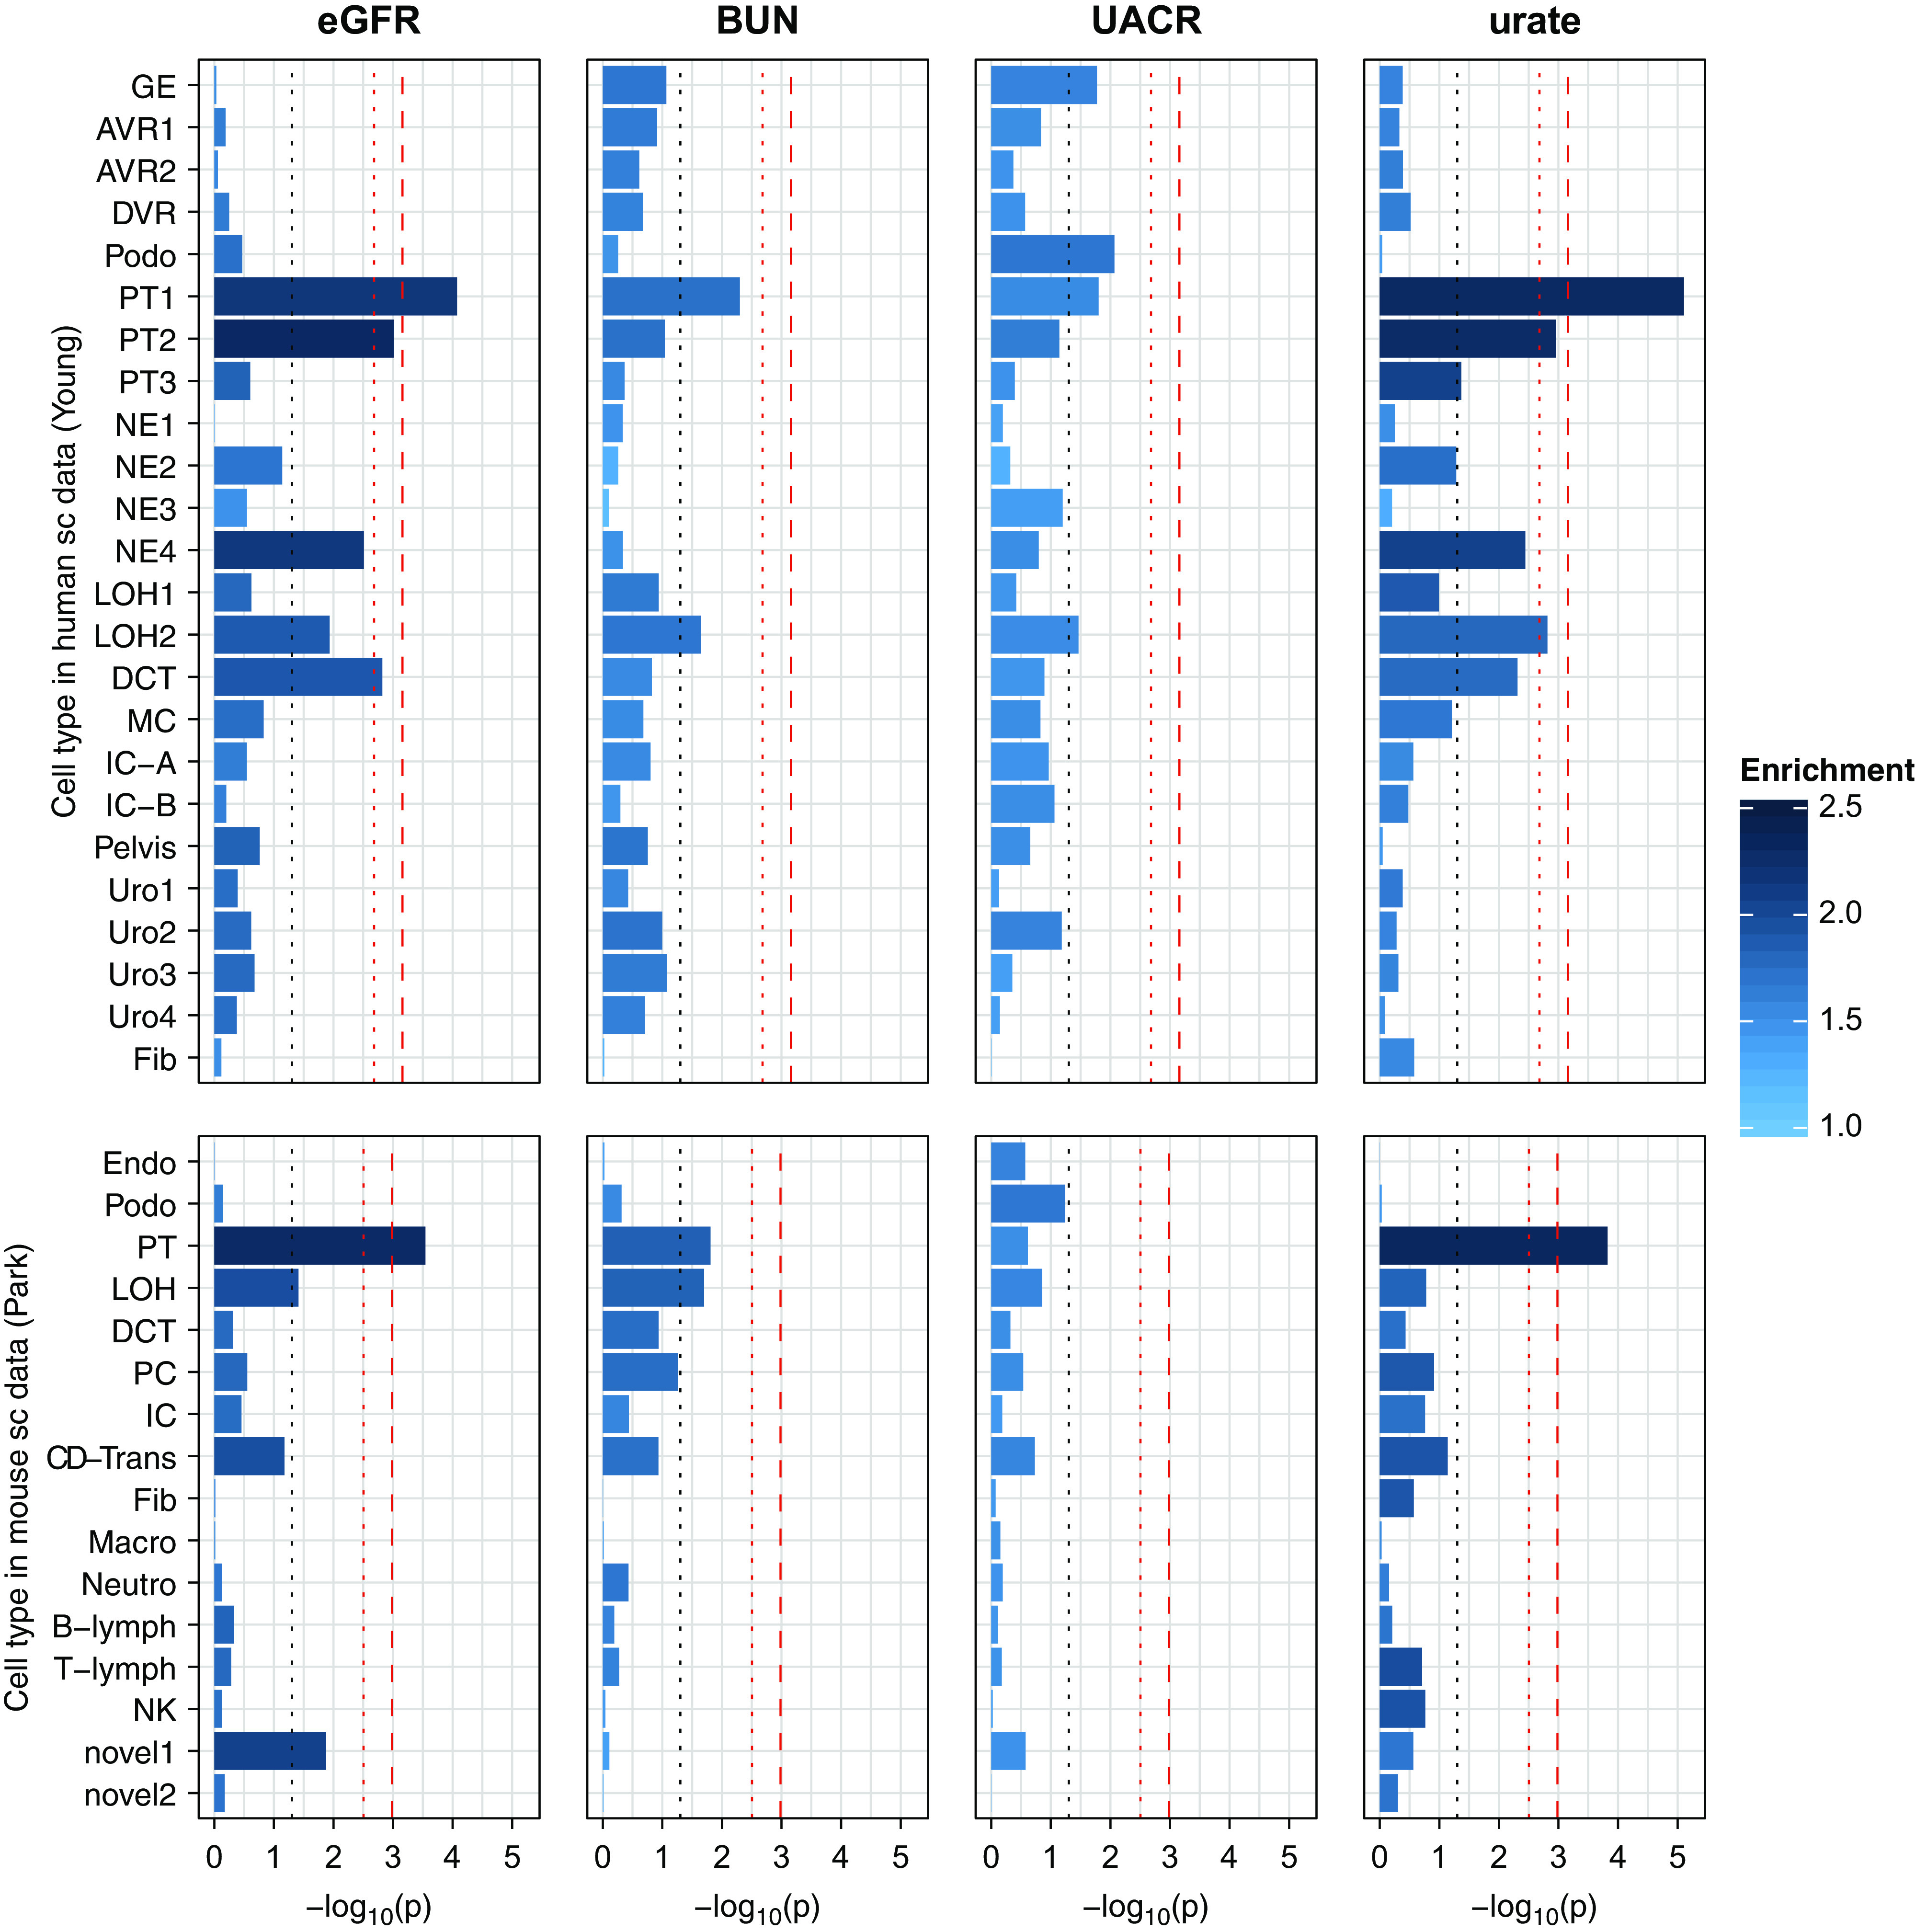
Figure 3.

Heritability enrichment for kidney traits in human and mouse single-cell (sc) datasets. Bar plots of −log10 (P values) for four kidney traits across cell types in human and mouse sc datasets. The dashed red lines denote Bonferroni-adjusted significance (P=0.05/24/3=6.9E-4 in human and P=0.05/16/3=1.0E-3 in mouse), the dotted red lines denote suggestive significance (P=0.05/24=2.1E-3 and P=0.05/16=3.1E-3), and the dotted gray lines denote nominal significance (P=0.05). The color intensity of the bars denotes the enrichment values. AVR, ascending vasa recta; B-lymph, B lymphocyte; CD-Trans, collecting duct transient cell; DCT, distal convoluted tubule; DVR, descending vasa recta; Endo, endothelial cell; Fib, fibroblast; GE, glomerular epithelium; IC, intercalated cell; IC-A, intercalated cell type A; IC-B, intercalated cell type B; LOH, loop of Henle; Macro, macrophage; MC, mesangial cell; NE, nephron epithelium; Neutro, neutrophil; NK, natural killer cell; novel, novel cell type; PC, principal cell; Podo, podocyte; T-lymph, T lymphocyte.
