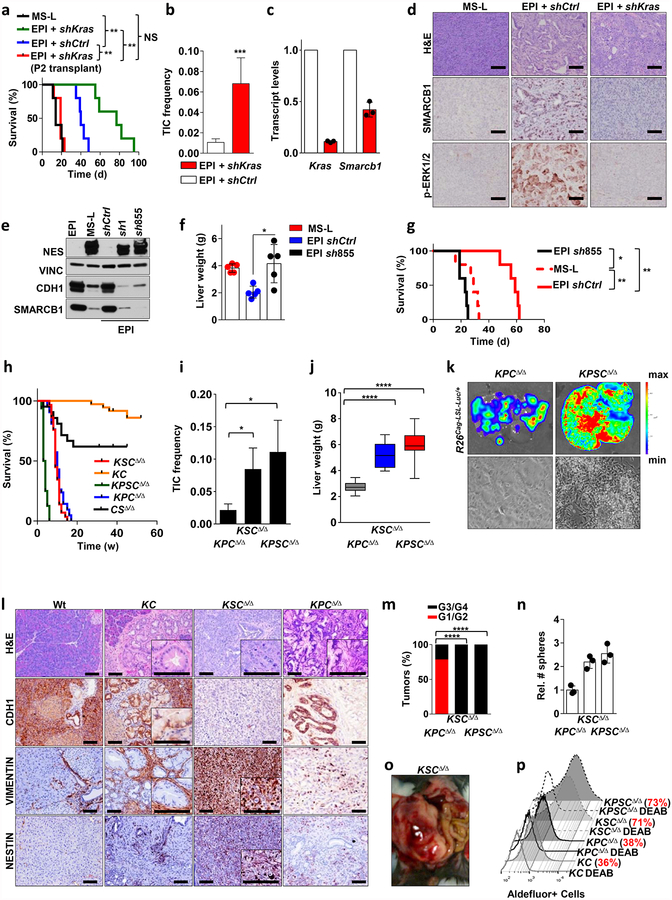
Extended Data Figure 3 |. Functional characterization of a Kras/Smarcb1 axis in the maintenance of epithelial identity and in mesenchymal reprograming.
a, RNAi-mediated knockdown of Kras in EPI-derived orthotopic transplants achieved with a lentiviral-based technology results in aggressive tumours that faithfully recapitulate the biological behaviour of MS-L transplants. Kaplan–Meier survival analysis of NCr Nude mice transplanted with MS-L escapers and EPI escapers transduced with either shCtrl or shKras constructs (n = 5 per group). Tumours emerging in the Kras-depleted group display longer latencies; however, once established, they faithfully recapitulate the behaviour of MS-L tumours in secondary transplants. b, TIC frequencies for shCtrl and shKras reprogrammed EPI escapers assessed by limiting dilution transplantation studies in immunocompromised (NCr Nude) mice (EPI and shCtrl: n = 27; EPI and shKras: n = 25) and calculated using the L-Calc software. Data are the mean proportion of TICs ± s.e.m. c, Transcript levels for Kras and Smarcb1 in EPI cells transduced with shCtrl or shKras constructs assessed by qPCR 96 h after transduction. RNAi-mediated depletion of Kras results in an acute drop in the levels of Smarcb1 (n = 3). Data are mean ± s.d. of technical replicates (one representative experiment out of three). d, Immunohistochemical quantification of the levels of phospho- ERK1/2 and SMARCB1 in tumours generated by EPI cells transduced with shCtrl or shKras constructs. Depletion of Kras results in tumours characterized by lack of activation of the MAPK signalling and a profound drop in the levels of nuclear SMARCB1. e, Western blot analysis of the expression of SMARCB1, E-cadherin (CDH1) and nestin in EPI, MS-L clones and EPI clones re-programmed with lentiviral-based shRNAs against Smarcb1 (sh1 and sh855). Vinculin was used as loading control. f, Liver-seeding assay for the quantification of metastatic potential. Liver weight of NCr Nude mice that receievd an intra-splenic injection of EPI cells infected with a lentiviral vector harbouring a control shRNA or a shRNA against Smarcb1 (sh855). MS-L cells were used as positive controls (n = 5 per group). Data are mean ± s.d. of biological replicates. RNAi-mediated ablation of Smarcb1 results in higher metastatic burden. g, Kaplan–Meier analysis of survival of NCr Nude mice orthotopically injected with EPI cells that were infected with a lentiviral vector harbouring a control shRNA or a shRNA against Smarcb1 (sh855). MS-L cells were used as positive control (n = 5 per group). h, Ablation of Smarcb1 in the pancreatic epithelia potently co-operates with mutant KrasG12D in driving aggressive tumours with full penetrance and a median latency of 5–7 weeks. Kaplan–Meier survival analysis. Pdx1-Cre-KrasG12DLSL/+-Smarcb1LoxP/LoxP (KSCΔ/Δ), n = 29; Pdx1-Cre-KrasG12DLSL/+-Tp53LoxP/+\LoxP (KPCΔ/Δ), n = 42; Pdx1-Cre-Smarcb1LoxP/LoxP (CSΔ/Δ), n = 21; Pdx1-Cre-KrasG12DLSL/+(KC), n = 36; Pdx1-Cre-KrasG12DLSL/+-Tp53LoxP/LoxP-Smarcb1LoxP/LoxP (KPSCΔ/Δ), n = 16). KSCΔ/Δ versus KC, P < 0.0001; KPSCΔ/Δ versus KSCΔ/Δ, P < 0.0001; KPSCΔ/Δ versus KPCΔ/Δ, P < 0.0001 by Mantel–Cox log-rank test. i, TIC frequency in Smarcb1-ablated tumours (KSCΔ/Δ, KPSCΔ/Δ) compared to the Smarcb1-proficient background (KPCΔ/Δ), as assessed by limiting-dilution transplantation experiments in NCr Nude mice (KPCΔ/Δ, n = 20; KSCΔ/Δ, n = 20; KPSCΔ/Δ, n = 18) and calculated using the L-Calc software. Data shown as the mean proportion of TICs ± s.e.m. j, Liver weight of NCr Nude mice receiving intra-splenic transplants of low-passage tumour cells isolated from KPCΔ/Δ-R26Cag-LSL-Luc/+, KSCΔ/Δ-R26Cag-LSL-Luc/+ and KPSCΔ/Δ-R26Cag-LSL-Luc/+ tumours (n = 10 per group). Data are mean ± s.d. of biological replicates. k, Top, representative luciferase images for liver-seeding assays described in j. The intensity of the signal is proportional to the metastatic burden. Colour scale bar is a reference for the intensity of the luminescence signal. Bottom panels show representative images of low-passages tumour cells in 2D. Original image magnification, ×20. Cells lacking Smarcb1 are loosely cohesive and characterized by a prominent mesenchymal morphology and a propensity for growth in suspension. l, Immunohistochemical profile of Smarcb1-deficient tumours (KSCΔ/Δ) compared to Smarcb1-proficient lesions (KC, KPCΔ/Δ) and wild-type (Wt) pancreata. Samples were stained for the EMT markers vimentin, nestin and CDH1. Normal wild-type pancreata, pre-neoplastic lesions from the KC background and PDAC from the KPCΔ/Δ background were used as controls. At 8–10 weeks old, mice were killed and pancreata/pancreatic lesions were collected. Hallmarks of Smarcb1-ablated tumours are the complete loss of CDH1 and the robust expression of the mesenchymal markers vimentin and nestin when compared to neoplastic and pre-malignant lesions originating in the Smarcb1-proficient backgrounds (KC and KPCΔ/Δ). m, Histopathological grade distribution in conditional GEMMs of PDAC (KPCΔ/Δ, n = 28; KSCΔ/Δ, n = 29; KPSCΔ/Δ, n = 15). n, Spherogenic potential of low-passage spheroids obtained from tumours arising in the KPCΔ/Δ, KSCΔ/Δ and KPSCΔ/Δ genetic background (n = 3 per group). Data are mean ± s.d. of technical replicates (one representative experiment out of three). o, Representative gross image of a KSCΔ/Δ mouse at necropsy. p, FACS analysis for the putative stem-cell marker aldefluor in freshly isolated tumour cells from the KC, KPCΔ/Δ, KSCΔ/Δ and KPSCΔ/Δ backgrounds. Diethylaminobenzaldehyde-treated cells were used as negative control. Smarcb1-deficient cells display a robust increase in the relative number of aldefluor positive cells. For gel source data see Supplementary figures. NS, not significant; *P < 0.05, ** P < 0.01, *** P < 0.001, ****P < 0.0001, by Mantel–Cox log-rank test (a, g), two-tailed chi-squared test (b, i), unpaired two-tailed t-test (f, j) or two-tailed Fisher’s exact test (m). Scale bars: 100 μm (d, l).

