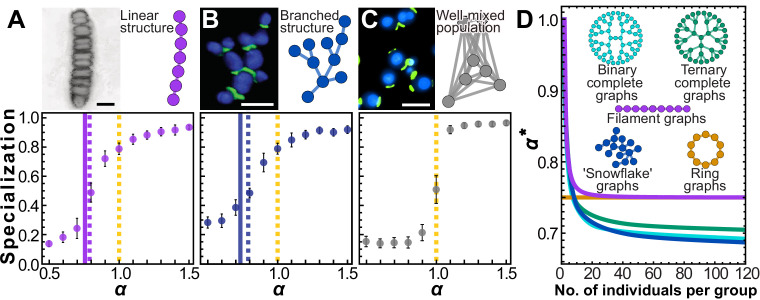
Figure 4. Simple multicellular organisms with sparse topologies.
We show two examples of simple multicellular organisms with linear and branched topologies. The image in (A) is a fossilized rhodophyte specimen of Bangiomorpha pubescens, courtesy of Prof. Nicholas Butterfield (see e.g. Butterfield, 2000); the image in (B) is a confocal image of ‘snowflake yeast’ showing cell volumes in blue and cell-cell connections in green; the image in (C) is an epifluorescence image of individual yeast cells from a planktonic culture, with the same staining technique as in (B). Scale bars in pictures = 10 µm. Panels include cartoons depicting simplified topologies. Topologically similar to the two-neighbor configuration, these configurations yield similar simulation results. Specialization is plotted as a function of α. Solid (A) and blue (B) vertical lines (A and B) indicate analytical solutions for the transition point where the Hessian evaluated at stops being negative definite, that is, ; dotted lines indicate roughly where the simulation curves cross specialization of 0.5, that is, the 'true' transition value of α where specialization becomes favored. (C) In contrast, for a well-mixed group with fully connected topology, , indicating specialization only occurs when there are accelerating returns on investment. (D) To further explore trees and filaments we analytically solved for for various types of trees and filaments of different sizes. is plotted versus group size for several topologies. This is a proxy measure of how amenable a network structure is to specialization.
Prof. Butterfield has granted permission to distribute the image in panel A under the terms of a Creative Commons Attribution license [https://creativecommons.org/licenses/by/4.0/]; further reproduction of this image should adhere to the terms of the CC BY 4.0 license with an attribution to Prof. Butterfield.

