
Author response image 7. Evolution of resource sharing.
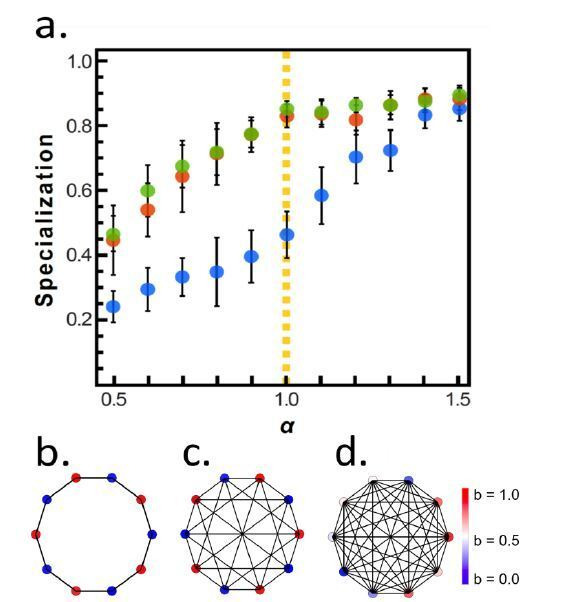
(a) Initially, individuals do not share resources; however, they may evolve to do so via random mutations. Here, the mean specialization of the fittest of 100 groups each with 10 cells after 100,000 steps is plotted as a function of specialization power. Error bars are standard deviations across 10 replicates. Blue is the fully connected network, red is the neighbor network, and green is the balanced bipartite topology. (b-d) The final distribution of specialization values for individual cells in fully connected (b), nearest-neighbor (c), and balanced bipartite topologies (d). The color of cells in b-d represents their degree of specialization, as indicated in the scale bar.