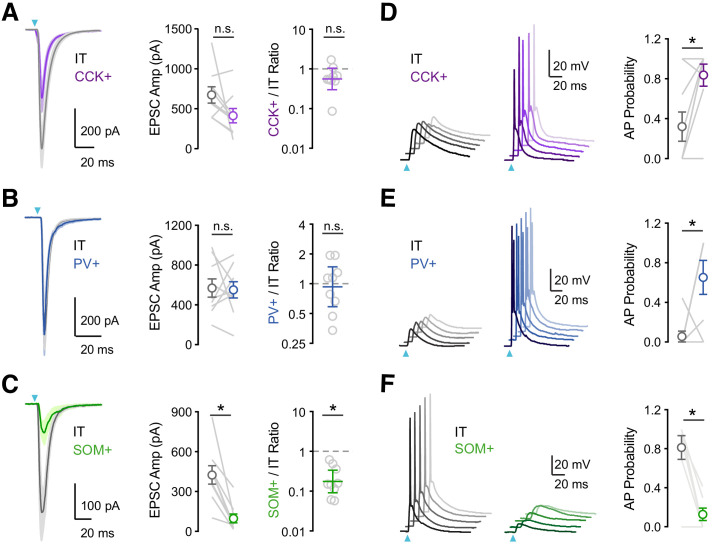
Figure 2. vHPC inputs differentially engage PV+, SOM+, and CCK+ interneurons.
(A) Left, Average vHPC-evoked EPSCs at pairs of L5 IT (gray) and CCK+ (purple) cells in IL PFC. Blue arrow = light pulse. Middle, Summary of EPSC amplitudes. Right, Summary of CCK+/IT EPSC amplitude ratios (n = 9 pairs, 4 animals). (B – C) Similar to (A) for pairs of IT and PV+ (blue) cells (n = 9 pairs, 4 animals) or pairs of IT and SOM+ (green) cells (n = 9 pairs, 4 animals). (D) Left, vHPC-evoked EPSPs and APs recorded in current-clamp from resting membrane potential at pairs of L5 IT (gray) and CCK+ (purple) cells in IL PFC, with 5 traces offset for each cell. Right, Summary of AP probability at pairs of IT and CCK+ cells. Blue arrow = 3.5 mW light pulse (n = 9 pairs, 4 animals). (E – F) Similar to (D) for pairs of IT and PV+ cells (3.5 mW light pulses, n = 8 pairs, 4 animals) or pairs of IT and SOM+ cells (4.8 mW light pulses, n = 7 pairs, 3 animals). *p<0.05.

