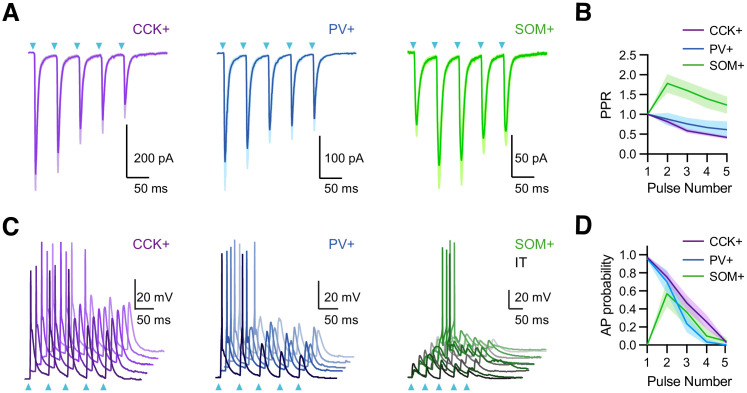
Figure 3. vHPC inputs drive interneurons with distinct temporal dynamics.
(A) Left, Average vHPC-evoked EPSCs at CCK+ interneurons, recorded in voltage-clamp at −65 mV (5 pulses at 20 Hz). Blue arrows = light pulses (n = 6 cells, 3 animals). Middle, For PV+ interneurons (n = 7 cells, 3 animals). Right, For SOM+ interneurons (n = 8 cells, 3 animals). (B) Average paired-pulse ratio (PPR) of vHPC-evoked EPSCs at CCK+, PV+, and SOM+ interneurons. (C) Left, vHPC-evoked EPSPs and APs, recorded in current-clamp from resting membrane potential at an example CCK+ interneuron in L5 of IL PFC, with 5 traces offset for the cell. Blue arrows = light pulses (n = 12 cells, 5 animals). Middle, For PV+ interneurons (n = 6 cells, 3 animals). Right, For SOM+ interneurons. Note that each SOM+ cell was studied with a nearby IT cell under the same recording and stimulation conditions, where the absence of AP firing at IT cells indicated subthreshold of network recurrent activation (n = 6 cells, 3 animals). (D) Summary of average AP probability as a function of pulse number for CCK+, PV+, and SOM+ interneurons.

