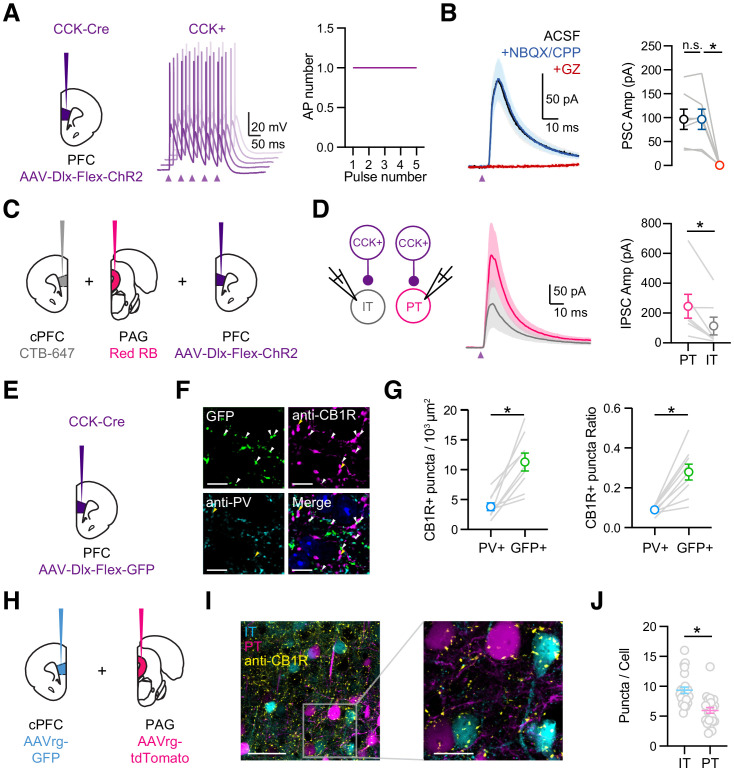
Figure 4. CCK+ interneurons make connections onto pyramidal cells.
(A) Left, Injections of AAV-Dlx-Flex-ChR2 into the PFC of CCK-Cre animals. Middle, Example AP traces from a ChR2-expressing CCK+ interneuron, stimulated with 2 ms light pulses at 20 Hz, showing 5 offset trials. Purple arrow = light pulse. Right, Average AP numbers across stimulation pulses (n = 6 cells, 3 animals). (B) Left, Average CCK+-evoked IPSCs at L5 pyramidal cells in IL PFC. When recording at −50 mV with a low Cl- internal solution, only outward IPSCs were observed (black). IPSCs were unchanged after wash-in of NBQX + CPP (blue) but abolished by wash-in of gabazine (red). Right, Summary of IPSC amplitudes in the different conditions. Purple arrow = light pulse. (C) Schematic of triple injections, with CTB-647 into cPFC, red retrobeads into PAG, and AAV-Dlx-Flex-ChR2 into PFC. (D) Left, Recording schematic of CCK+ inputs onto IT and PT cells. Middle, CCK+-evoked IPSCs at PT and IT cells. Right, Summary of IPSC amplitudes at PT and IT cells (7 cells, 4 animals). (E) Injection schematic. (F) Confocal images of GFP (green), anti-CB1R staining (purple), anti-PV staining (cyan), and merge. Blue labeling in merged image = DAPI. Arrow heads: white = GFP+CB1R+ co-labeling, yellow = PV+CB1R+ co-labeling. (G) Left, Quantification of PV+CB1R+ and GFP+CB1R+ quanta per 103 µm2. Right, Quantification of the ratios of CB1R+ puncta among PV+ and GFP+ puncta. Each line represents counts from one slice (n = 9 slices, 3 animals). (H) Injection schematic of AAVrg-GFP into PFC and AAVrg-tdTomato into PAG. (I) Left, Confocal image of IT cells (cyan), PT cells (magenta), and CB1 receptors (yellow). Scale bar = 50 µm. Right, Magnification of region on left. Scale bar = 20 µm. (J) Quantification of CB1R puncta in IT and PT cells, each dot represents the average puncta number per cell in a slice (n = 247 IT cells, 207 PT cells, 4 animals). *p<0.05.


