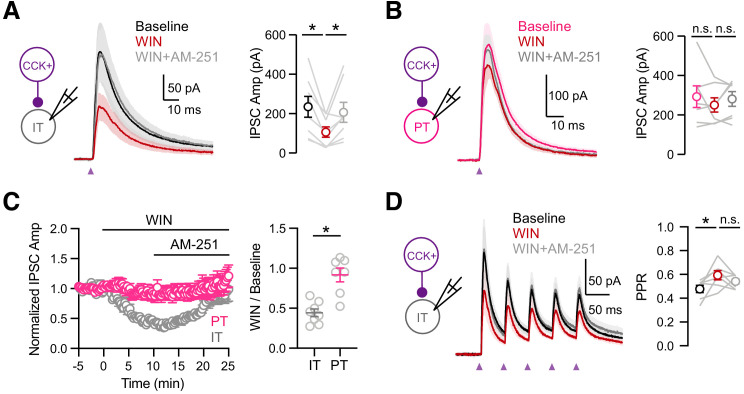
Figure 6. Cell-type specific modulation by CB1 receptors.
(A) Left, Schematic of recordings from IT cells in L5 of IL PFC. Middle, Average CCK+-evoked IPSCs at IT cells at baseline (black), 10 min after wash-in of 1 µM WIN 55,212–2 (red), and 15 min after additional wash-in of 10 µM AM-251 (gray). Purple arrow = light stimulation. Right, Summary of IPSC amplitudes (n = 8 cells, 5 animals). (B) Similar to (A) for CCK+-evoked IPSCs at PT cells, showing lack of modulation by CB1R (n = 7 cells, 4 animals). (C) Left, Summary of time course of modulation at IT and PT cells, with IPSC amplitudes normalized to the average response during the first 5 min. Right, Summary of normalized IPSC amplitudes after WIN wash-in. (D) Similar to (C) for trains of CCK+ inputs onto IT cells (5 pulses at 20 Hz), showing small increase in PPR after wash-in of 1 µM WIN 55,212–2 (n = 7 cells, 4 animals). *p<0.05.
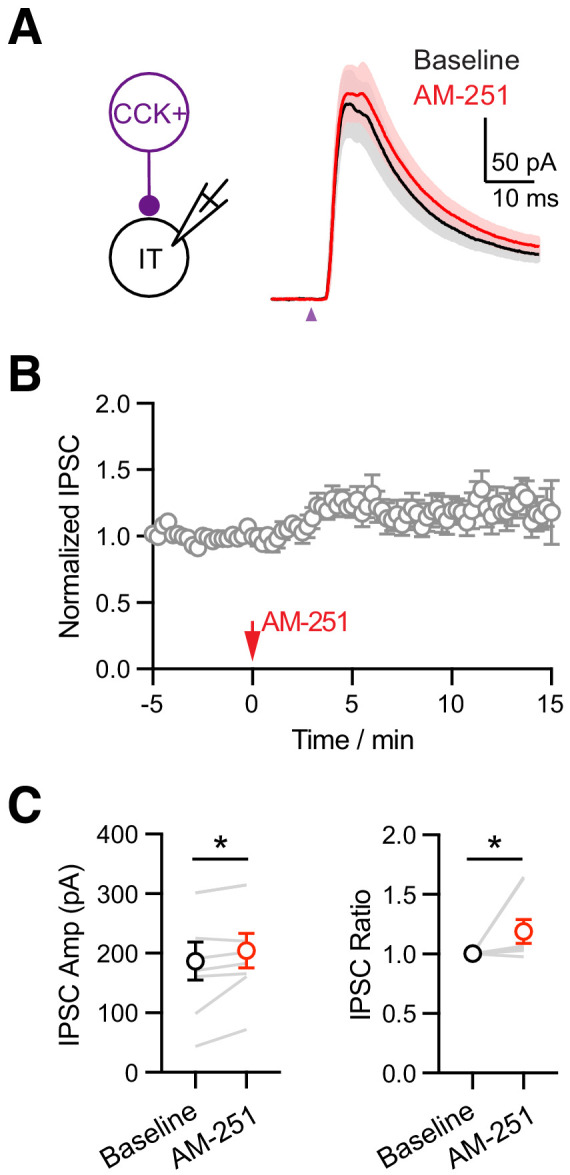
Figure 6—figure supplement 1. The effect of AM-251 on CCK+ inputs to IL L5 IT cells.


