
Author response image 2. Quantification of PPR.
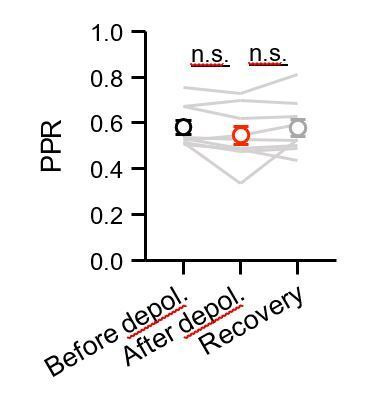
Quantification of PPR of CCK+ inputs at IT cells before (black), after (red) and recovery (gray) from depolarization in the DSI experiment (n = 9 cells, 5 animals).
Official websites use .gov
A
.gov website belongs to an official
government organization in the United States.
Secure .gov websites use HTTPS
A lock (
) or https:// means you've safely
connected to the .gov website. Share sensitive
information only on official, secure websites.
Quantification of PPR of CCK+ inputs at IT cells before (black), after (red) and recovery (gray) from depolarization in the DSI experiment (n = 9 cells, 5 animals).