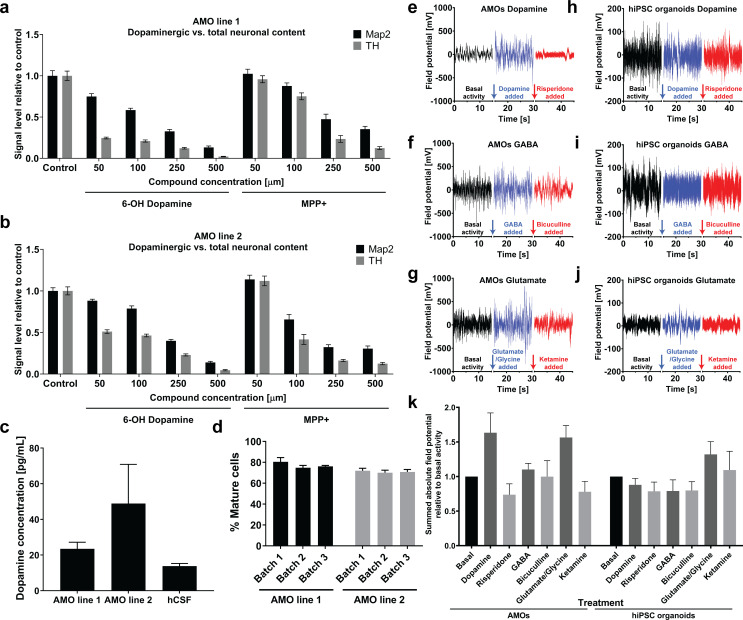
Figure 8. Automated midbrain organoids possess functional characteristics of midbrain tissue and allow assessment of neural subpopulations for high-throughput screening.
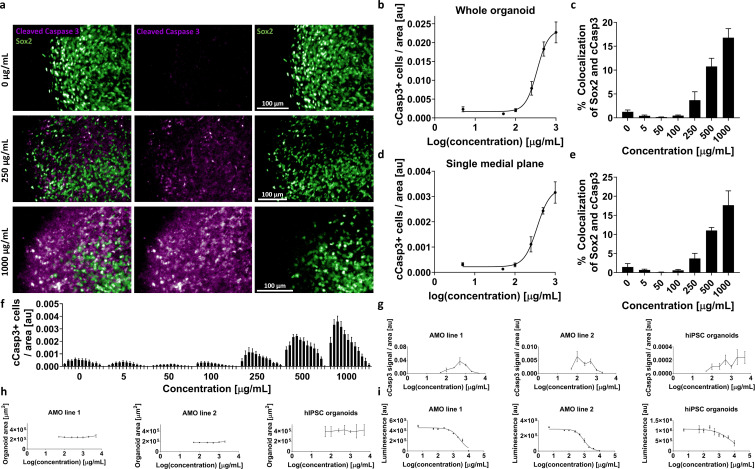
(a/b) The combination of AMOs and our automated whole mount staining and clearing workflow allows the quantification of dopaminergic neuron-specific toxicity in 3D. 6-Hydroxy dopamine and MPP+ specifically ablate TH-positive dopaminergic neurons from the AMOs in a dose-dependent manner and with little variation between replicates and cell lines. n ≥ 6 organoids per data point, Error bars: SEM. Organoids at day 56 of differentiation. (c) 35 days old AMOs secrete dopamine into their cell culture medium under standard culture conditions and without further stimulation, as confirmed by ELISA. The concentration is in the same range as the dopamine levels measured in the cerebrospinal fluid (CSF) of healthy, adult humans as reported by Goldstein et al., 2012. nLine 1 = 4, nLine 2 = 3, nhCSF = 38, Error bars: SEM. (d) 70–80% percent of cells within the AMOs are negative for the precursor marker Sox2 after 30 days of differentiation. AMO line 1: nBatch1 = 90, nBatch2 = 16, nBatch3 = 15; AMO line 2: nBatch1 = 89, nBatch2 = 16, nBatch3 = 14; Error bars: SD. (e–j) AMOs respond most strongly to dopaminergic modulation and, to a lesser extent, also to glutamatergic modulation while the automated cortical hiPSC organoids are mostly affected by compounds targeting glutamatergic neurons. MEA measurements of individual AMOs (e–g) or cortical hiPSC organoids (h–j) were performed in three stages on the same sample: first, under basal conditions (black line), second, after treatment with an agonist (blue line), and third, after addition of an antagonist (red line). The pharmacological modulators targeted dopaminergic (e/h), GABAergic (f/i), or glutamatergic (g/j) neurons. The gaps in the X-axis represent the addition of the different compounds and the time we allowed for the solution to equilibrate. Shown is the raw signal of one representative example of n = 4. AMOs were at 33 days and hiPSCs at 35 days of differentiation. (k) Quantification of the effects of pharmacological modulation on AMOs and automated hIPSC organoids as measured by MEA. The bar graph shows the sum of the absolute electric field potential oscillations over 15 s of time relative to basal conditions for each modulator. Each bar represents the mean +/- SEM for n = 4 replicates, one representative raw measurement per condition is shown in (e-j). n = 4, except nhiPSC organoids Glutamate = 3; Also see Figure 8—figure supplement 1.


