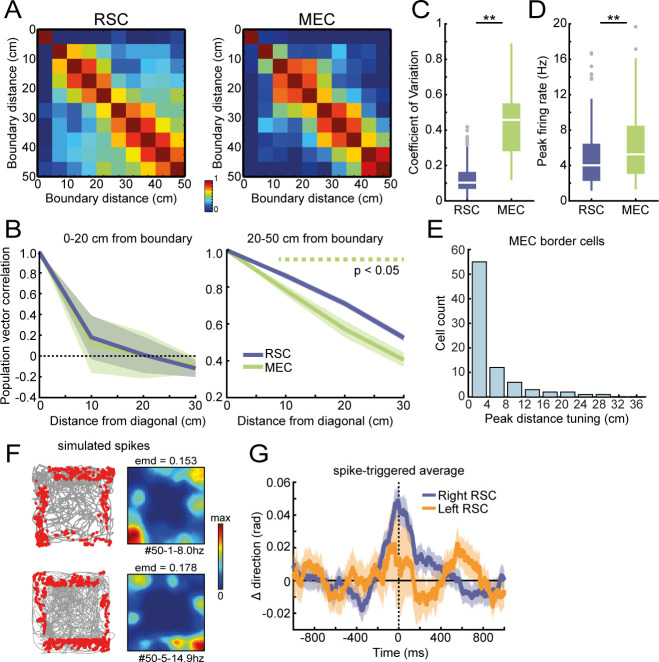
Figure 6. Firing of RSC border cells provides local boundary information and is correlated with the animal’s future motion.
(A) Spike trajectory plots and spatial rate maps of typical border cells recorded in RSC and MEC. (B) Proportion of border cells in RSC and MEC that had significant directional tuning to allocentric head-direction or egocentric boundary-direction. (C) A decoder using a support vector machine (SVM) classifier estimated the animal's distance to the wall based on population spiking activity. Local distance information was present in both regions but extended further into the center of the arena only in MEC. (D) Self-motion maps were computed based on short trajectories of the animal, giving lateral and frontal displacements (Δx and Δy, respectively) and distance traveled, Dist, in 100 ms time bins relative to the animal’s forward head-direction, giving a self-centered moving direction, θm, at each timepoint. (E) Example motion map of an RSC border cell with spike times shifted in time relative to the animal’s motion data. A firing field emerged on left turns when spikes were shifted −200 to −500 ms before motion. (F) RSC border cells fired prospective to motion, where the amount of information present in motion maps is maximal when spike timings were shifted −50 to −300 ms earlier. (G) MEC border cells by contrast did not show any prospective or retrospective activity. (H) Spike-triggered average of changes in direction, calculated as the difference of moving directions in 250 ms bins, where positive values indicate right turns. RSC spikes preceded turning behavior of the animal by ~200 ms, with border cells in opposing hemispheres firing prospectively to ipsilateral turns. (I) MEC spikes by contrast were not locked to any change in the animal’s behavior. *p<0.05, t-test.


