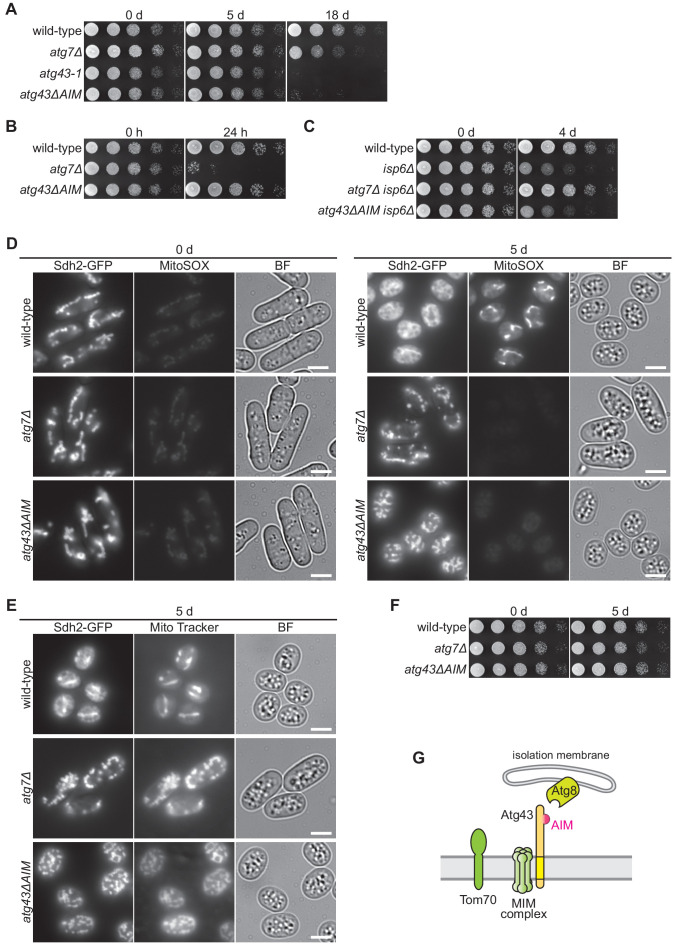
Figure 7. Mitophagy maintains growth ability during nitrogen starvation.
(A–C) The indicated strains were grown in EMM and shifted to EMM–N. Cells were collected at the indicated time points after induction of nitrogen starvation and spotted onto solid YES medium for the growth assay. Cells auxotrophic for leucine, uracil, histidine, and lysine (leu1-32, ura4, his7, lys1) were used in (B). (D, E) Cells were collected at the indicated time points after induction of nitrogen starvation and stained with MitoSOX (D) or Mito Tracker (E). Sdh2-GFP was detected as a mitochondrial marker. Scale bars represent 5 µm. BF, bright-field image. (F) Serial dilutions of the indicated strains collected immediately before or 5 days after induction of nitrogen starvation were spotted onto glycerol plates. (G) Schematic model for mitophagy mediated by Atg43 on the MOM.

