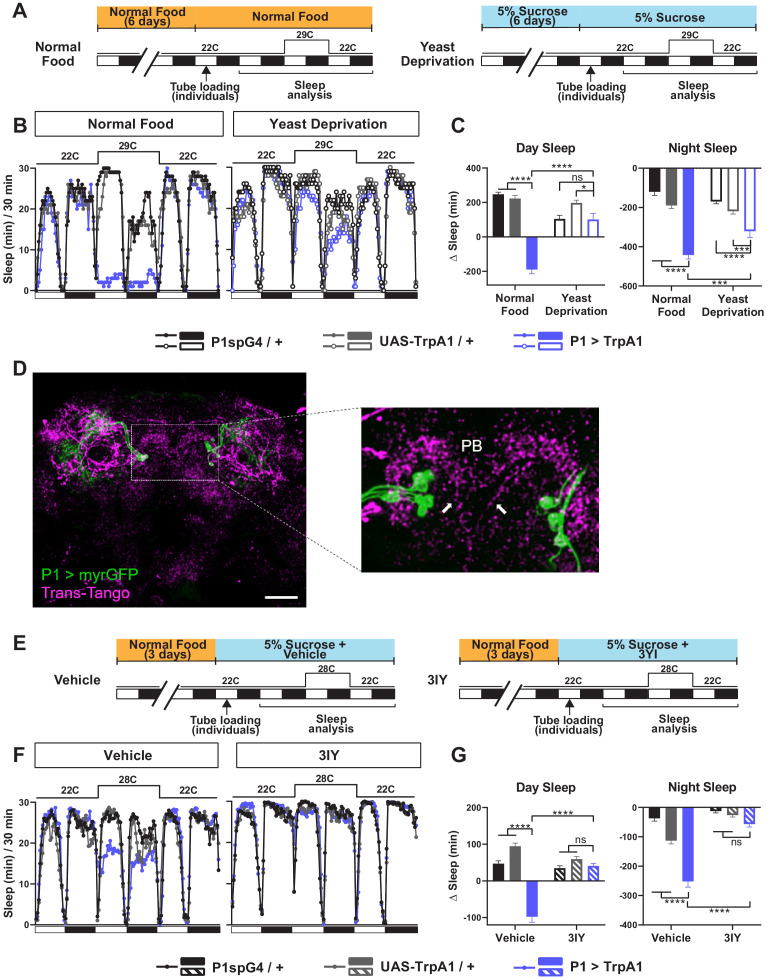
Figure 4. Yeast deprivation and inhibition of dopamine signaling impairs the wake-promoting effects of P1 activation, and trans-Tango tracing identifies potential downstream targets of P1 neurons.
(A) Schematic diagram of the experimental design for (B) and (C). (B) Sleep profiles in 30 min intervals for experimental (P1 >TrpA1) and parental control (P1-spG4 / + and UAS-TrpA1 / +) males in normal food or yeast deprivation conditions, loaded into tubes containing normal food or 5% sucrose, respectively. N = 29–32. TrpA1 was activated by raising the temperature from 22°C to 29°C. (C) Daytime and nighttime sleep change (sleep at 29°C – baseline sleep at 22°C) for flies shown in (B). (D) Confocal projection of an adult male brain in which trans-Tango was driven by P1 split Gal4 (spG4). Presynaptic P1 neurons express myrGFP (green) and postsynaptic targets express mtdTomato (red). Right image shows a magnification of the PB region, with postsynaptic neurons that innervate the PB. Arrows indicate descending projections used to identify DA-PB neurons. Scale bar represents 50 μm. (E) Sleep profiles in 30 min intervals for experimental (P1 >TrpA1) and parental control (P1-spG4 / + and UAS-TrpA1 / +) male flies. Flies were raised on normal food and individually loaded into tubes containing 5% sucrose supplemented with vehicle (propionic acid) or 3IY (inhibitor of dopamine synthesis). N = 40–48. TrpA1 was activated by raising the temperature from 22°C to 28°C. (G) Daytime and nighttime sleep change (sleep at 28°C – baseline sleep at 22°C) for flies shown in (F). ***p<0.001, ****p<0.0001, ns: not significant, two-way ANOVA, followed by Tukey post-hoc test (C) and (G); p<0.0001 for the interaction between genotype and nutritional condition (C); p<0.0001 for the interaction between genotype and drug condition (G).

