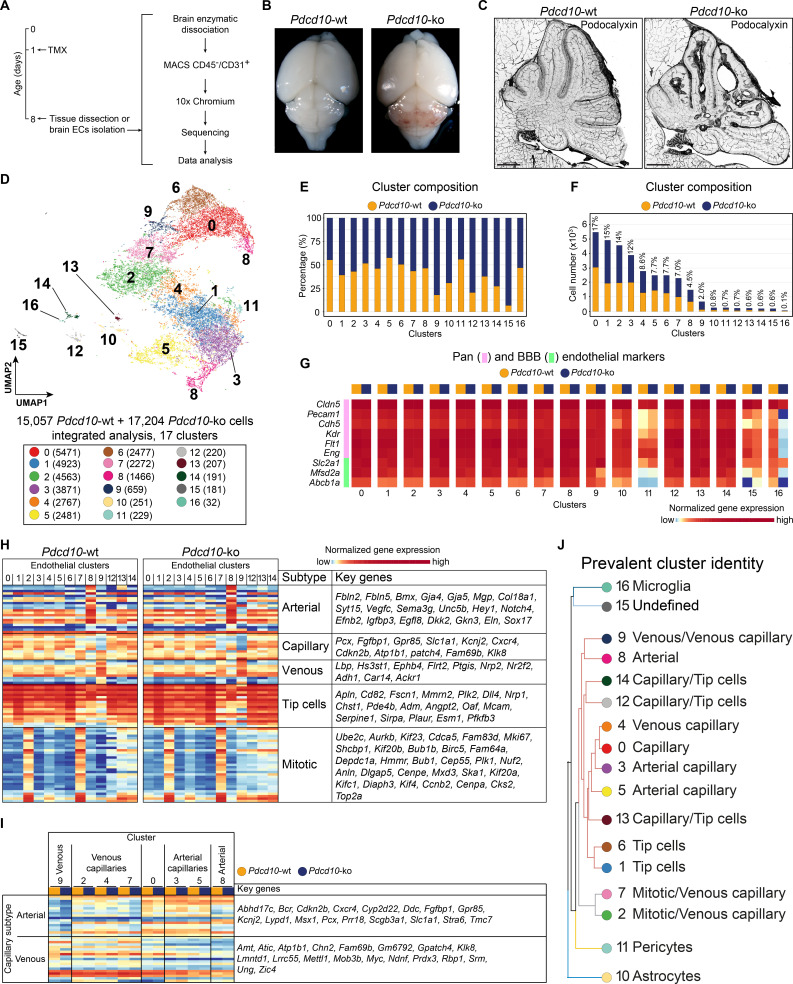
Figure 1. scRNA-sequencing of Pdcd10-wt and Pdcd10-ko endothelial cells.
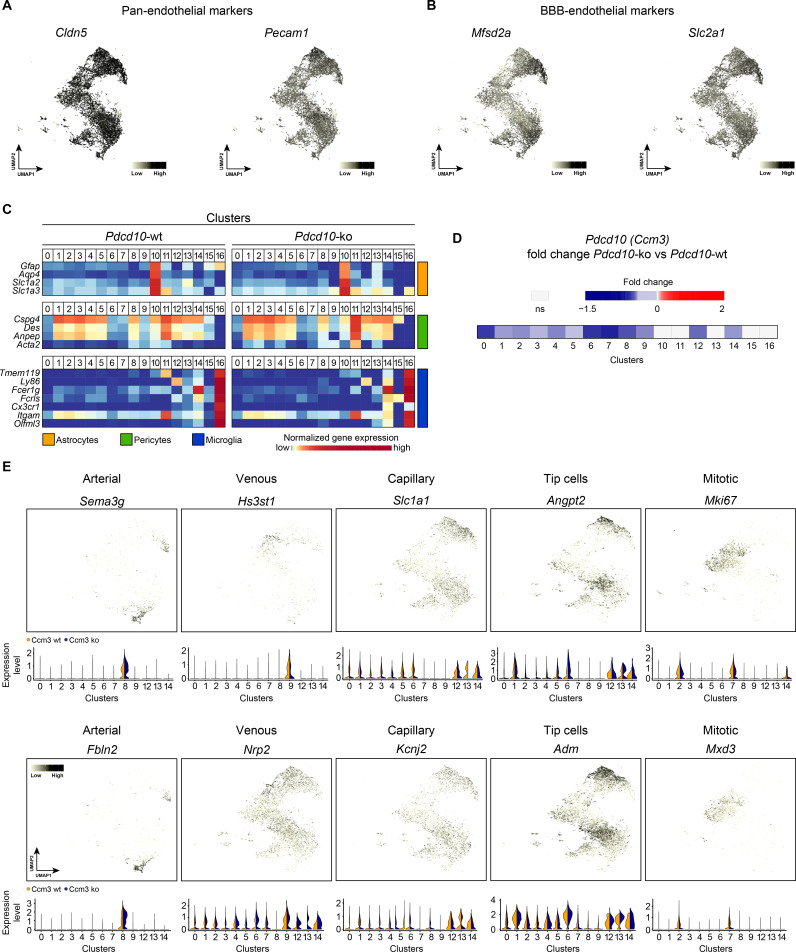
(A) Experimental scheme (see Materials and methods for details). (B) Representative photographs of Pdcd10-wt (left) and Pdcd10-ko (right) whole brains at P8. (C) Representative confocal microscopy of the vasculature of Pdcd10-wt (left) and Pdcd10-ko (right) cerebella at P8, stained for Podocalyxin (black; see also Figure 1—figure supplement 1). Scale bars: 1 mm. (D) UMAP plot showing detected cell subpopulations in the Pdcd10-wt and Pdcd10-ko integrated analysis. The total numbers of cells within each cluster are shown in brackets in the color legend (bottom panel). (E) Plot of the percentages of Pdcd10-wt (orange) and Pdcd10-ko (blue) cells in each of the cluster. (F) Plot of the numbers of Pdcd10-wt (orange) and Pdcd10-ko (blue) cells in each cluster. The percentages of total cells in each cluster (%) is reported above each bar. (G) Heatmap of the selected pan- (pink) and blood–brain barrier- (BBB; green) endothelial cell markers (normalized expression shown; see Materials and methods) for the Pdcd10-wt and Pdcd10-ko cells in each cluster. (H) Heatmap of the selected endothelial cell subtype markers (from top to bottom, as indicated: arterial, capillary, venous, tip cells, mitotic), to show the normalized expression levels of the Pdcd10-wt (left) and Pdcd10-ko (right) cells in each cluster (see also Supplementary file 1). For each subtype, the key genes are listed accordingly (top-to-bottom). (I) Heatmap of normalized expression of arterial and venous capillary markers in the capillary and mitotic/capillary clusters (C0, C2, C3, C4, C5, C7). The venous (C9; left) and arterial (C8; right) clusters are reported for reference. The Pdcd10-wt (orange) and Pdcd10-ko cells (blue) are shown separately. Key genes are listed according to the top-to-bottom order in the heatmap. (J) Summary of the prevalent identities of the 17 clusters based on endothelial cell subtype marker expression as in (H, I) and Figure 1—figure supplement 1. The dendrogram of the hierarchical clustering is shown on the left. Non/mixed-ECs clusters (C10, C11, C15, C16) show early segregation. Arterial/venous (C8, C9), capillary (C0, C3, C4, C5), tip (C1 and C6) and mitotic/capillary (C2, C7) cells segregate as distinct groups of the final branches. Clusters 12, 13, and 14 show features of both capillaries and tip cells, but only C12 and C14 segregate on neighbor final branches.


