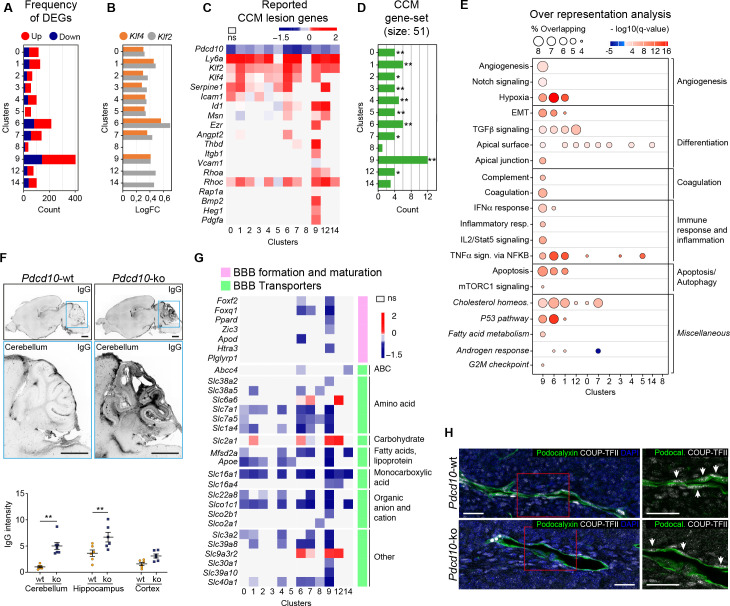
Figure 2. Pdcd10 deletion induces specific transcriptional profiles in distinct endothelial cell subpopulations.
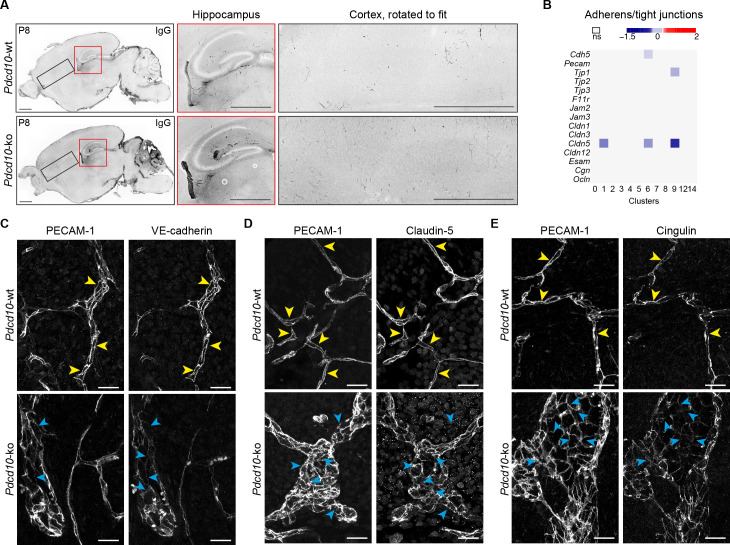
(A) Numbers of significant differentially expressed genes (DEGs) (padj <0.05) in each cluster, showing up-regulation (red) and down-regulation (blue). (B) Average log fold changes of Klf4 (orange) and Klf2 (gray) expression in each cluster (Pdcd10-ko vs. Pdcd10-wt; padj <0.05). (C) Heatmap of selected known CCM lesion markers, as average logFC (padj <0.05) of Pdcd10-ko versus Pdcd10-wt cells (see also Supplementary file 2). (D) Enrichment of CCM-associated genes (source: Rare Diseases GeneRIF Library) among DEGs (Pdcd10-ko vs. Pdcd10-wt) for each cluster (see Materials and methods). X-axis indicates the number of DEGs identified as CCM-associated genes in each cluster. Asterisks show the significance of enrichment: *p<0.05; **p<0.01. (E) Over-representated Molecular Signatures Databases hallmark gene sets in DEGs (average |logFC| ≥ 0.3; padj <0.05, see Materials and methods). The sizes of the dots reflect the proportion (%) of overlap between the DEGs and the reference gene sets, while the intensities of the colors show the -log10(q-value), color coded in red for up-regulated gene sets and in blue for down-regulated gene sets. Gene sets in italics have not been described previously for CCM. (F) Representative confocal microscopy of IgG leakage in Pdcd10-wt (left) and Pdcd10-ko (right) brain sections. Bottom images: higher magnification of the cerebellum (light blue boxed areas at top). Higher magnification of the hippocampus and cortex are shown in Figure 2—figure supplement 1. Scale bars: 1 mm. Bottom panel: Quantification of IgG leakage (mean ± SEM; **p<0.01; ANOVA followed by Sidak multiple comparisons). Pdcd10-wt, n = 6; Pdcd10-ko, n = 7. (G) Heatmap of log fold expression changes of selected genes (padj <0.05) important for BBB formation and maturation (pink), and typical BBB transporters (green) between Pdcd10-ko and Pdcd10-wt. (H) Representative confocal microscopy of the venous marker COUP-TFII (encoded by the Nr2f2 transcript, white), Podocalyxin (pan-endothelial, green) and DAPI (blue) of a Pdcd10-wt vessel (top) and a Pdcd10-ko lesion (bottom), both in the cerebellum. Arrows, COUP-TFII–positive endothelial nuclei. Scale bars: 25 μm.


